ZimaOS is cooking my hardware plus constant system drive activity

I really would love to love ZimaOS. Long term CasaOS user. Few days ago switched to ZimaOS on my Optiplex 7050 micro. Paid for plus due few drives connected. Zima looks great, cool features and actively developed so all positives. I really like it.

Migrated all the apps, configs, data. All working fine, process was nice and easy.

And that is the end of good things.

Zima is cooking my hardware. I know, before start saying it was designed for zimaboard, cube etc. IT is compatible for 3rd party hardware so should work right?

System drive(nvme) is running at almost 40% higher temeperature than it was in casa, cpu give or take 20% higher, fans constantly kick in, like being at heathrow when planes go up every few minutes :slight_smile:

And i have this constant system drive activity of unknown origin. it reads/writes every 2 seconds, i’m guessing that is what keeps the temp high. And only on the main system drive Samsung NVME. i cannot figure out what it is, stopped all containers - no change, disable samba, remote login, search, widgets, backup only in manual. Disconnected USB drives. Still nothing.

Updated this morning to 1.6.2 with hope it will improve something. Nope

Any advise how, what to check?

Many thanks for your assistance, please help me stay with ZimaOS. :slight_smile:

Hi mate, welcome to the forum.

The constant NVMe activity is worth checking properly, especially since it continues with the containers stopped.

Please run these two commands:

lsblk -o NAME,MODEL,SIZE,FSTYPE,MOUNTPOINTS
pidstat -d 1 10

The second command runs for about 10 seconds and then stops automatically. It will show which processes are reading from or writing to disk.

Please post the full output from both commands. Once we confirm the ZimaOS system-drive name, we can run a filtered check against that drive only.

I have been playing with it over the last couple of days, even had to reinstall zimaos due to some other issues, fitted heatsink to nvme to keep it cooler, helped a little bit, What i have noticed is on my test-rig, same model of pc, but different nvme, this 2 second activity is not noticed, one blip every 10 sec more or less, seems normal, no higher nvme temp. Could it be this particular nvme that i have in my main unit not being compatible? Firmware on it causes an issue? Not sure. Anyway that 2 second activity is present as soon as zima starts first time. You log in, no apps installed and it blips every 2 seconds. Output from both commands, had to run pidstat with sudo, otherwise it was empty:

NAME MODEL SIZE FSTYPE MOUNTPOINTS
loop0 4.5M squashfs
loop1 1.1M squashfs
loop2 208K squashfs
loop3 208K squashfs
loop4 4.5M squashfs
loop5 1.1M squashfs
sda P3-2TB 1.9T btrfs /var/lib/casaos_data/.media/SSD-Data
/DATA/.media/SSD-Data
/media/SSD-Data
sdb ST4000DM000-1F2168 3.6T ext4 /var/lib/casaos_data/.media/Barracuda
/DATA/.media/Barracuda
/media/Barracuda
sdc ST4000DM004-2CV104 3.6T ext4 /var/lib/casaos_data/.media/Backup
/DATA/.media/Backup
/media/Backup
sdd WDC WD40EFPX-68C6CN0 3.6T ext4 /var/lib/casaos_data/.media/CLOUD
/DATA/.media/CLOUD
/media/CLOUD
sde ST4000VN006-3CW104 3.6T ext4 /var/lib/casaos_data/.media/IRONWOLF
/DATA/.media/IRONWOLF
/media/IRONWOLF
nbd0 0B
nbd1 0B
nbd2 0B
nbd3 0B
nbd4 0B
nbd5 0B
nbd6 0B
nbd7 0B
nvme0n1 SAMSUNG MZVL8512HELU-00BKS 476.9G
├─nvme0n1p1 32M vfat /mnt/boot
├─nvme0n1p2 24M squashfs
├─nvme0n1p3 6G squashfs
├─nvme0n1p4 24M squashfs
├─nvme0n1p5 6G squashfs /
├─nvme0n1p6 8M
├─nvme0n1p7 96M ext4 /var/lib/rauc
│ /var/lib/zerotier-one
│ /mnt/overlay
└─nvme0n1p8 464.8G ext4 /var/log
/var/lib/systemd/coredump
/var/lib/libvirt
/var/lib/icewhale
/var/lib/extensions
/var/lib/docker
/var/lib/casaos
/opt
/var/lib/bluetooth
/media
/DATA
/var/lib/casaos_data
nbd8 0B
nbd9 0B
nbd10 0B
nbd11 0B
nbd12 0B
nbd13 0B
nbd14 0B
nbd15 0B

Linux 6.18.9 (Delta-Cloud) 07/12/2026 x86_64 (8 CPU)

02:03:09 PM UID PID kB_rd/s kB_wr/s kB_ccwr/s iodelay Command
02:03:10 PM 0 2070 148.51 0.00 0.00 0 zimaos-welcome

02:03:10 PM UID PID kB_rd/s kB_wr/s kB_ccwr/s iodelay Command

02:03:11 PM UID PID kB_rd/s kB_wr/s kB_ccwr/s iodelay Command
02:03:12 PM 0 283 0.00 4.00 0.00 0 systemd-journal

02:03:12 PM UID PID kB_rd/s kB_wr/s kB_ccwr/s iodelay Command
02:03:13 PM 0 2070 150.00 0.00 0.00 0 zimaos-welcome

02:03:13 PM UID PID kB_rd/s kB_wr/s kB_ccwr/s iodelay Command

02:03:14 PM UID PID kB_rd/s kB_wr/s kB_ccwr/s iodelay Command

02:03:15 PM UID PID kB_rd/s kB_wr/s kB_ccwr/s iodelay Command
02:03:16 PM 0 2070 150.00 0.00 0.00 0 zimaos-welcome

02:03:16 PM UID PID kB_rd/s kB_wr/s kB_ccwr/s iodelay Command

02:03:17 PM UID PID kB_rd/s kB_wr/s kB_ccwr/s iodelay Command

02:03:18 PM UID PID kB_rd/s kB_wr/s kB_ccwr/s iodelay Command

Average: UID PID kB_rd/s kB_wr/s kB_ccwr/s iodelay Command
Average: 0 283 0.00 0.40 0.00 0 systemd-journal
Average: 0 2070 44.96 0.00 0.00 0 zimaos-welcome

The output gives us a useful lead. The activity is not pointing to Docker or the NVMe firmware at this stage.

zimaos-welcome is reading about 150 kB every few seconds, which closely matches the activity you are seeing. The journal write is negligible.

Please run these two commands:

sudo systemctl status 2070 --no-pager -l
sudo sh -c 'printf "Command: "; tr "\0" " " </proc/2070/cmdline; echo; printf "Executable: "; readlink -f /proc/2070/exe; printf "Cgroup: "; cat /proc/2070/cgroup'

Please post the complete output. This should identify the exact ZimaOS service and executable behind the repeated reads before we consider stopping or changing anything.

● zimaos-welcome@tty1.service - ZimaOS Welcome
Loaded: loaded (/usr/lib/systemd/system/zimaos-welcome@.service; enabled; preset: enabled)
Drop-In: /usr/lib/systemd/system/zimaos-welcome@.service.d
└─zimaos-welcome.conf
Active: active (running) since Sat 2026-07-11 01:02:24 BST; 2 days ago
Invocation: c722f24fc9484738bf7c400ee2ef9233
Main PID: 2070 (zimaos-welcome)
Tasks: 1 (limit: 38369)
Memory: 4.1M (peak: 13.7M)
CPU: 3h 39min 2.287s
CGroup: /system.slice/system-zimaos\x2dwelcome.slice/zimaos-welcome@tty1.service
└─2070 /bin/bash /usr/sbin/zimaos-welcome

Jul 11 01:02:24 Delta-Cloud systemd[1]: Started ZimaOS Welcome.
deltacloud@Delta-Cloud:~ ➜ $ sudo sh -c ‘printf "Command: "; tr “\0” " " </proc/2070/cmdline; echo; printf "Executable: "; readlink -f /proc/2070/exe; printf "Cgroup: "; cat /proc/2070/cgroup’
Command: /bin/bash /usr/sbin/zimaos-welcome
Executable: /usr/bin/bash
Cgroup: 0::/system.slice/system-zimaos\x2dwelcome.slice/zimaos-welcome@tty1.service

Thanks, this confirms the repeating activity is associated with:

zimaos-welcome@tty1.service
/bin/bash /usr/sbin/zimaos-welcome

The service has also accumulated over 3 hours of CPU time in 2 days, which is worth investigating.

Please run:

sudo systemctl cat zimaos-welcome@tty1.service
sudo sed -n '1,240p' /usr/sbin/zimaos-welcome

Please post the complete output from both. I believe there may be a polling loop inside the welcome script, but we need to confirm the script before recommending any change.

/usr/lib/systemd/system/zimaos-welcome@.service

[Unit]
Description=ZimaOS Welcome
After=systemd-user-sessions.service plymouth-quit-wait.service getty-pre.target
Conflicts=getty@%i.service

:5:245m# If additional gettys are spawned during boot then we should make
:5:245m# sure that this is synchronized before getty.target, even though
:5:245m# getty.target didn’t actually pull it in.
Before=getty.target

:5:245m# IgnoreOnIsolate causes issues with sulogin, if someone isolates
:5:245m# rescue.target or starts rescue.service from multi-user.target or
:5:245m# graphical.target.
Conflicts=rescue.service
Before=rescue.service

[Service]
:5:245m# the VT is cleared by TTYVTDisallocate
:5:245m# The ‘-o’ option value tells agetty to replace ‘login’ arguments with an
:5:245m# option to preserve environment (-p), followed by ‘–’ for safety, and then
:5:245m# the entered username.
ExecStart=/usr/sbin/zimaos-welcome
Type=idle
Restart=always
RestartSec=2
UtmpIdentifier=%I
TTYPath=/dev/%I
TTYReset=yes
TTYVHangup=yes
TTYVTDisallocate=yes
IgnoreSIGPIPE=no
SendSIGHUP=yes
StandardInput=tty-force
StandardOutput=inherit
StandardError=inherit

[Install]
WantedBy=multi-user.target

/usr/lib/systemd/system/zimaos-welcome@.service.d/zimaos-welcome.conf

[Install]
DefaultInstance=tty1

~
~
~
~
~
~
~
~
~
deltacloud@Delta-Cloud:~ ➜ $ sudo sed -n ‘1,240p’ /usr/sbin/zimaos-welcome
#!/bin/bash

CASA_CONF_PATH=/etc/casaos/gateway.ini
IP_BIN=“$(command -v ip 2>/dev/null || true)”
CRUDINI_BIN=“$(command -v crudini 2>/dev/null || true)”
GRUBENV_BIN=“$(command -v grub-editenv 2>/dev/null || true)”
SYSTEMCTL_BIN=“$(command -v systemctl 2>/dev/null || true)”

MANUFACTURER=“Unknown”
MODEL=“Unknown”
PRETTY_NAME=“ZimaOS”
BUILD_DATE=“Unknown”
SN=“Unknown”
MESSAGE=“”

shellcheck disable=SC1091

[ -r /etc/zimaos-release ] && . /etc/zimaos-release

if [ -r /var/lib/casaos/baseinfo.conf ]; then
SN=“$(sed -n 's/.“i”:“([^”])”.*/\1/p’ /var/lib/casaos/baseinfo.conf)"
[ -n “$SN” ] || SN=“Unknown”
fi

TTY_STATE=“”
TTY_DEVICE=“/dev/tty”
if tty_path=“$(tty 2>/dev/null)” && [ “$tty_path” != “not a tty” ]; then
TTY_DEVICE=“$tty_path”
fi
if [ -r “$TTY_DEVICE” ]; then
TTY_STATE=“$(stty -g <”$TTY_DEVICE" 2>/dev/null || true)"
stty -echo -icanon min 0 time 0 <“$TTY_DEVICE” 2>/dev/null || true
fi

cleanup_terminal() {
printf “\033[?25h”
if [ -n “$TTY_STATE” ]; then
stty “$TTY_STATE” <“$TTY_DEVICE” 2>/dev/null || true
fi
}

trap cleanup_terminal EXIT INT TERM

清除终端内容和滚动缓冲区,移除之前的 systemd 启动信息

printf “\033[2J\033[3J\033[H”

get_crudini_value() {
[ -n “$CRUDINI_BIN” ] || return 1
[ -r “$CASA_CONF_PATH” ] || return 1
“$CRUDINI_BIN” --get “$CASA_CONF_PATH” “$1” “$2” 2>/dev/null
}

get_hostname() {
if [ -r /etc/hostname ]; then
cat /etc/hostname
else
echo “localhost”
fi
}

get_uptime() {
if command -v uptime >/dev/null 2>&1; then
uptime -p
else
echo “unknown”
fi
}

getips() {
[ -n “$IP_BIN” ] || return 0

for NIC in /sys/class/net/*; do
    # 检查路径是否存在,避免 I/O 错误
    [ -e "$NIC" ] || continue
    NIC=$(basename "$NIC" 2>/dev/null) || continue
    [ -n "$NIC" ] || continue
    # Skip virtual interfaces except thunderboltbr0
    case "$NIC" in
        thunderboltbr0)
            if [ "$(cat /sys/class/net/thunderboltbr0/operstate)" = "up" ]; then
                "$IP_BIN" addr show "$NIC" | grep inet | grep -v 127.0.0.1 | grep -v inet6 | awk '{print $2}' | cut -d/ -f1
            fi
            ;;
        wlan*|bonding_masters)
            # Skip wireless and bonding_masters
            ;;
        *)
            # Check if it's not a virtual interface
            if [ ! -e "/sys/devices/virtual/net/$NIC" ]; then
                "$IP_BIN" addr show "$NIC" | grep inet | grep -v 127.0.0.1 | grep -v inet6 | awk '{print $2}' | cut -d/ -f1
            fi
            ;;
    esac
done | sort

}

current_slot() {
local arg

for arg in $(cat /proc/cmdline 2>/dev/null); do
    case "$arg" in
        rauc.slot=*)
            printf '%s\n' "${arg#rauc.slot=}"
            return
            ;;
    esac
done

printf 'unknown\n'

}

other_slot() {
case “$(current_slot)” in
A) printf ‘B\n’ ;;
B) printf ‘A\n’ ;;
*) printf ‘unknown\n’ ;;
esac
}

grubenv_path() {
sed -n ‘s/^grubenv=//p’ /etc/rauc/system.conf 2>/dev/null | head -n 1
}

ensure_boot_mount() {
local path

path="$(grubenv_path)"
[ -n "$path" ] || return 1

if [ ! -e "$path" ] && [ -n "$SYSTEMCTL_BIN" ]; then
    "$SYSTEMCTL_BIN" start mnt-boot.mount >/dev/null 2>&1 || true
fi

[ -e "$path" ]

}

slot_device_for() {
local slot=“$1” kind=“$2”

case "$slot:$kind" in
    A:kernel) printf '/dev/disk/by-partlabel/casaos-kernel0\n' ;;
    A:rootfs) printf '/dev/disk/by-partlabel/casaos-system0\n' ;;
    B:kernel) printf '/dev/disk/by-partlabel/casaos-kernel1\n' ;;
    B:rootfs) printf '/dev/disk/by-partlabel/casaos-system1\n' ;;
    *) return 1 ;;
esac

}

verify_slot_bootable() {
local slot=“$1” kernel_dev rootfs_dev temp_root temp_kernel temp_rootfs rc

kernel_dev="$(slot_device_for "$slot" kernel)" || return 1
rootfs_dev="$(slot_device_for "$slot" rootfs)" || return 1

[ -e "$kernel_dev" ] || {
    MESSAGE="Slot ${slot} kernel partition is missing."
    return 1
}
[ -e "$rootfs_dev" ] || {
    MESSAGE="Slot ${slot} rootfs partition is missing."
    return 1
}

temp_root="$(mktemp -d /run/zimaos-slot-check.XXXXXX 2>/dev/null || mktemp -d /tmp/zimaos-slot-check.XXXXXX)" || return 1
temp_kernel="${temp_root}/kernel"
temp_rootfs="${temp_root}/rootfs"
mkdir -p "$temp_kernel" "$temp_rootfs"
rc=0

if ! mount -o ro "$kernel_dev" "$temp_kernel" >/dev/null 2>&1; then
    MESSAGE="Slot ${slot} kernel image is not mountable."
    rc=1
elif [ ! -f "${temp_kernel}/bzImage" ]; then
    MESSAGE="Slot ${slot} kernel image does not contain bzImage."
    rc=1
fi
umount "$temp_kernel" >/dev/null 2>&1 || true

if [ "$rc" -eq 0 ]; then
    if ! mount -o ro "$rootfs_dev" "$temp_rootfs" >/dev/null 2>&1; then
        MESSAGE="Slot ${slot} rootfs image is not mountable."
        rc=1
    elif [ ! -f "${temp_rootfs}/usr/lib/os-release" ] && [ ! -f "${temp_rootfs}/etc/os-release" ]; then
        MESSAGE="Slot ${slot} rootfs does not look like ZimaOS."
        rc=1
    fi
    umount "$temp_rootfs" >/dev/null 2>&1 || true
fi

rmdir "$temp_kernel" "$temp_rootfs" "$temp_root" >/dev/null 2>&1 || true
return "$rc"

}

schedule_other_slot_reboot() {
local current target path

current="$(current_slot)"
target="$(other_slot)"

if [ "$current" != "A" ] && [ "$current" != "B" ]; then
    MESSAGE="Cannot detect current RAUC slot."
    return 1
fi

MESSAGE="Checking slot ${target} before reboot..."
draw_screen

if ! verify_slot_bootable "$target"; then
    return 1
fi

[ -n "$GRUBENV_BIN" ] || {
    MESSAGE="grub-editenv is not available."
    return 1
}

ensure_boot_mount || {
    MESSAGE="Cannot access GRUB environment."
    return 1
}

path="$(grubenv_path)"
"$GRUBENV_BIN" "$path" list >/dev/null 2>&1 || {
    MESSAGE="GRUB environment is invalid."
    return 1
}

if ! "$GRUBENV_BIN" "$path" set "ORDER=${target} ${current}" ||
    ! "$GRUBENV_BIN" "$path" set "${target}_OK=1" ||
    ! "$GRUBENV_BIN" "$path" set "${target}_TRY=0" ||
    ! "$GRUBENV_BIN" "$path" set "${current}_OK=1" ||
    ! "$GRUBENV_BIN" "$path" set "${current}_TRY=0"; then
    MESSAGE="Failed to update GRUB environment."
    return 1
fi

MESSAGE="Rebooting into slot ${target}..."
draw_screen
sleep 1

if [ -n "$SYSTEMCTL_BIN" ]; then

Thanks, this is helpful.

The repeated disk reads are still pointing at zimaos-welcome, but the script output ends before its main loop. We need to see the remaining section and any refresh interval.

Please run:

sudo sed -n '241,520p' /usr/sbin/zimaos-welcome
sudo grep -nE 'while|until|sleep|draw_screen|getips|get_hostname|get_uptime' /usr/sbin/zimaos-welcome

Please post both outputs. I believe the final part of the script is repeatedly refreshing the local console screen, which would match the regular reads, but we need to confirm the exact loop before suggesting any change.

    "$SYSTEMCTL_BIN" reboot || MESSAGE="Failed to request reboot."
else
    reboot || MESSAGE="Failed to request reboot."
fi

}

confirm_slot_switch() {
local current target key deadline now hold_count bar

current="$(current_slot)"
target="$(other_slot)"

if [ "$target" != "A" ] && [ "$target" != "B" ]; then
    MESSAGE="Cannot detect the other RAUC slot."
    return 1
fi

deadline=$(( $(date +%s) + 8 ))
hold_count=0

while :; do
    now="$(date +%s)"
    [ "$now" -lt "$deadline" ] || {
        MESSAGE="Slot switch canceled."
        return 1
    }

    bar="$(printf '%*s' "$hold_count" '' | tr ' ' '#')"
    printf "\033[H\033[J"
    cat <<EOF

ZimaOS Slot Switch

Current slot: ${current}
Target slot: ${target}

Hold “s” for about two seconds, or press “y”, to reboot into slot ${target}.
Press “n” or Esc to cancel.

EOF
printf ’ Confirmation: [%-20s]\n’ “$bar”

    key=""
    IFS= read -r -n 1 -t 0.25 key || true
    case "$key" in
        y|Y)
            MESSAGE="Preparing slot ${target} reboot..."
            return 0
            ;;
        s|S)
            hold_count=$((hold_count + 3))
            [ "$hold_count" -ge 20 ] && {
                MESSAGE="Preparing slot ${target} reboot..."
                return 0
            }
            ;;
        n|N|$'\033')
            MESSAGE="Slot switch canceled."
            return 1
            ;;
        *)
            if [ "$hold_count" -gt 0 ]; then
                hold_count=$((hold_count - 1))
            fi
            ;;
    esac
done

}

生成显示内容的函数

generate_display() {
ips=“$1”
hostname=“$2”

# 输出一个空行
echo
echo " ███████╗██╗███╗   ███╗ █████╗  ██████╗ ███████╗"
echo " ╚══███╔╝██║████╗ ████║██╔══██╗██╔═══██╗██╔════╝"
echo "   ███╔╝ ██║██╔████╔██║███████║██║   ██║███████╗"
echo "  ███╔╝  ██║██║╚██╔╝██║██╔══██║██║   ██║╚════██║"
echo " ███████╗██║██║ ╚═╝ ██║██║  ██║╚██████╔╝███████║"
echo " ╚══════╝╚═╝╚═╝     ╚═╝╚═╝  ╚═╝ ╚═════╝ ╚══════╝"
echo
echo " Manufacturer:  ${MANUFACTURER}"
echo " Model:         ${MODEL}"
echo " OS:            ${PRETTY_NAME}"
echo " Build date:    ${BUILD_DATE}"
echo " Serial:        ${SN}"
echo " Hostname:      ${hostname}"
echo " Kernel:        $(uname -r)"
echo " Uptime:        $(get_uptime)"
echo

if [ -z "$ips" ]; then
    echo " Searching for network address..."
    echo
    echo " If this persists, please check your network connection."
else
    echo " ZimaOS can be accessed by opening any Zima client. If you don't see"
    echo " this device there, check \"${hostname} on your network\"."
    echo

    LL=
    for ip in $ips; do
        if [ "${ip#169.254.}" != "$ip" ]; then
            LL="(Thunderbolt4/USB4)"
        elif [ -n "$IP_BIN" ]; then
            LL="($("$IP_BIN" -o -4 addr show | grep "$ip" | awk '{print $2}'))"
        else
            LL=""
        fi
        # 检查SSL是否启用
        SSL_ENABLED="$(get_crudini_value ssl enabled)"
        if [ -z "$SSL_ENABLED" ]; then
            # section 或 key 不存在,给默认值
            SSL_ENABLED="false"
        fi
        
        if [ "$SSL_ENABLED" = "true" ]; then
            # SSL启用,使用SSL端口和https协议
            PORT="$(get_crudini_value ssl port)"
            PROTOCOL="https"
        else
            # SSL未启用,使用gateway端口和http协议
            PORT="$(get_crudini_value gateway port)"
            PROTOCOL="http"
        fi

        [ -n "$PORT" ] || PORT=$([ "$PROTOCOL" = "https" ] && echo 443 || echo 80)
        
        # 显示访问地址
        if [ "$PORT" = "443" ] || [ "$PORT" = "80" ]; then
            DISPLAY_PORT=""
        else
            DISPLAY_PORT=":${PORT}"
        fi
        echo " ZimaOS Web UI can be directly accessed at: ${PROTOCOL}://${ip}${DISPLAY_PORT}" "$LL"
    done

    echo
    echo "    NOTE: The SSH service is disabled by default. Please enable it through"
    echo "    the WebUI by accessing the above address."
    echo
    if [ -r /etc/shadow ]; then
        ROOT_HASH=$(awk -F: '/^root:/{print $2}' /etc/shadow)
        if [ -z "$ROOT_HASH" ] || [ "$ROOT_HASH" = "!" ] || [ "$ROOT_HASH" = "*" ]; then
            echo "    Enable root login over SSH, you need to set the root password. "
            echo "    Pressing \"Alt+F2\" execute \"passwd\" to set it."
        fi
    fi

fi

echo
echo "    Maintenance: Press \"s\" to switch to the other RAUC slot and reboot."
[ -n "$MESSAGE" ] && echo "    Message: ${MESSAGE}"

}

draw_screen() {
IPS=“$(getips)”
HOSTNAME=“$(get_hostname)”
NEW_CONTENT=“$(generate_display “$IPS” “$HOSTNAME”)”

printf "\033[H\033[J"
echo "$NEW_CONTENT"
OLD_CONTENT="$NEW_CONTENT"

}

handle_key() {
case “$1” in
s|S)
if confirm_slot_switch; then
schedule_other_slot_reboot || true
fi
draw_screen
;;
esac
}

IPS=force
OLD_CONTENT=“”

首次显示

clear

关闭tty1的光标显示

printf “\033[?25l”

while :; do
IPS2=“$(getips)”
IPS=“$IPS2”
HOSTNAME=“$(get_hostname)”

# 生成新的显示内容
NEW_CONTENT="$(generate_display "$IPS" "$HOSTNAME")"

# 只有当内容发生变化时才重新绘制屏幕
if [ "$NEW_CONTENT" != "$OLD_CONTENT" ]; then
    # 使用光标移动而不是clear,避免闪烁
    printf "\033[H\033[J"  # 移动光标到左上角并清除屏幕
    echo "$NEW_CONTENT"
    OLD_CONTENT="$NEW_CONTENT"
fi

key=""
IFS= read -r -n 1 -t 3 key || true
if [ -n "$key" ]; then
    handle_key "$key"
fi

done
deltacloud@Delta-Cloud:~ ➜ $ sudo grep -nE ‘while|until|sleep|draw_screen|getips|get_hostname|get_uptime’ /usr/sbin/zimaos-welcome
52:get_hostname() {
60:get_uptime() {
68:getips() {
205: draw_screen
237: draw_screen
238: sleep 1
261: while :; do
331: echo " Uptime: $(get_uptime)"
399:draw_screen() {
400: IPS=“$(getips)”
401: HOSTNAME=“$(get_hostname)”
415: draw_screen
429:while :; do
430: IPS2=“$(getips)”
432: HOSTNAME=“$(get_hostname)”

Thanks, this confirms the repeated activity is coming from the zimaos-welcome console service.

The script runs continuously and refreshes every 3 seconds. During each cycle it checks the network interfaces, hostname, uptime and ZimaOS gateway configuration. That matches the repeated zimaos-welcome reads shown by pidstat.

This does not currently point to an incompatible NVMe or faulty firmware.

As a temporary test, stop only the local console welcome screen:

sudo systemctl stop zimaos-welcome@tty1.service

Then run:

sudo pidstat -d 1 10

The first command does not stop ZimaOS, Docker, SSH or the Web UI. It only removes the information screen shown on the directly connected monitor.

Please confirm whether the regular drive activity and temperature reduce after stopping it. Do not disable the service permanently yet.

Activity significantly reduced, now we have irregular blip every few seconds, but i do have all my apps re-enabled so it is to be expected. Regular 2 sec interval blip gone, CPU usage also dropped at idle from 4-5% to 1-2%.

Output from pidstat:

09:27:14 AM 0 283 0.00 12.00 0.00 0 systemd-journal
09:27:14 AM 0 714 0.00 20.00 0.00 0 jbd2/nvme0n1p8-8
09:27:14 AM 0 1804 0.00 4.00 0.00 0 zimaos-app-mana

09:27:14 AM UID PID kB_rd/s kB_wr/s kB_ccwr/s iodelay Command
09:27:15 AM 0 3368 0.00 24.00 0.00 0 python3

09:27:15 AM UID PID kB_rd/s kB_wr/s kB_ccwr/s iodelay Command

09:27:16 AM UID PID kB_rd/s kB_wr/s kB_ccwr/s iodelay Command

09:27:17 AM UID PID kB_rd/s kB_wr/s kB_ccwr/s iodelay Command

09:27:18 AM UID PID kB_rd/s kB_wr/s kB_ccwr/s iodelay Command
09:27:19 AM 0 283 0.00 16.00 0.00 0 systemd-journal
09:27:19 AM 0 1804 0.00 4.00 0.00 0 zimaos-app-mana

09:27:19 AM UID PID kB_rd/s kB_wr/s kB_ccwr/s iodelay Command

09:27:20 AM UID PID kB_rd/s kB_wr/s kB_ccwr/s iodelay Command

09:27:21 AM UID PID kB_rd/s kB_wr/s kB_ccwr/s iodelay Command

Average: UID PID kB_rd/s kB_wr/s kB_ccwr/s iodelay Command
Average: 0 283 0.00 2.79 0.00 0 systemd-journal
Average: 0 714 0.00 2.00 0.00 0 jbd2/nvme0n1p8-8
Average: 0 1804 0.00 0.80 0.00 0 zimaos-app-mana
Average: 0 3368 0.00 2.40 0.00 0 python3

Thanks for testing and reporting back.

That confirms the regular activity was being caused by zimaos-welcome@tty1.service, not by an incompatible NVMe.

After stopping the service:

  • the fixed 2–3 second activity disappeared
  • idle CPU dropped from around 4–5% to 1–2%
  • the remaining writes are small and irregular
  • the remaining activity is consistent with normal journaling and running apps

The service repeatedly checks the network, hostname, uptime and gateway configuration to refresh the directly connected console display. On your system, that continuous polling was enough to create noticeable NVMe activity and CPU usage.

The service will likely start again after a reboot, so I suggest leaving it stopped for now and reporting this behaviour to IceWhale as a ZimaOS 1.6.2 issue. I would not permanently modify or remove the system service until IceWhale confirms the intended fix.

This would also be a useful case to test with ZimaBrain CE. It can capture the system-drive layout, NVMe health and temperature, active services, failed units and other local evidence in one report. If you install it, please let us know whether it identifies anything relevant or misses anything in this case. That feedback would be very useful for improving it.

Please also let us know whether the NVMe and CPU temperatures reduce after the system has been idle for a while.

Will keep monitoring it, it looks like the CPU temp has dropped by 2-3 C at the moment, will check the drive in a bout an hour at idle.

How do we go about reporting that to Icewhale, sorry i’m still fresh on zima side, do not know the protocol :slight_smile:

I can run zimabrain ce, no problem. I have been playing with it on my test rig but to be honest struggling a bit asking proper questions. Basics like drive health etc i’m ok with. Can you suggest anything that would help us get the most info from it? And would be useful for the zimabrain improvement at the same time?

No problem, mate.

For IceWhale, I suggest keeping this thread as the main report because it already contains the hardware details, command output and the confirmed before-and-after result. I will also flag it for the ZimaOS team so they can review the zimaos-welcome polling behaviour in 1.6.2.

For ZimaBrain CE, please run a fresh session on the affected machine and ask these questions one at a time:

What needs attention on this ZimaOS system?
Show the system drive, its health, temperature and any storage warnings.
Are there any active or failed services that need attention?
Is there any evidence of unusual CPU, memory, swap or disk activity?
What ZimaOS version and kernel is this system running?
Are there any possible ZimaOS regressions or unusual system services in this report?
Summarise the evidence that would be useful for reporting this issue to IceWhale.

After asking those questions, please export the whole ZimaBrain session, not only an individual answer.

The most useful feedback for improving ZimaBrain would be:

  • what it identified correctly
  • anything important it missed
  • any answer that was unclear or misleading
  • whether the exported session contains enough evidence for this issue

Please remove or redact anything private before posting the export publicly. The main thing I want to see is whether ZimaBrain notices the service state, system-drive layout, temperatures and any wider issues around the repeated activity.

After some time at idle, CPU usage was stable at 1-2%, temperature as well stable across the board, CPU sitting at 39-40C (previously 42-43C), system drive, although after fitting heatsink, temp dropped to about 48C, with zimaos-welcome disabled, temp was sitting at 44C. Small differences one would say but in a long run - significant.

zimaos-welcome service re-enabled for zimabrain session.

ZimaBrain export (post below as i do not see upload file anywhere), couple of things look weird, when asking for system drive, it showed info about one of the other drives connected, i have asked about nvme and it showes info about all drives. some data like temperature missing. Hope this gives you some insight into zimabrain brain :slight_smile: I don’t think it found anything related to our rebellious welcome service.

# ZimaBrain CE Brain Session

Exported: 2026-07-13 10:47:25

## 1. What needs attention on this ZimaOS system?

Time: 2026-07-13 10:40:48

### ZimaBrain Answer

## :red_question_mark: Question asked

### What needs attention on this ZimaOS system?

#### Verification status

@@VERIFY:NOT VERIFIED@@ :cross_mark: NOT VERIFIED

- The question did not match a verified diagnostic layer. This answer is guidance only.

- Active layer: Fallback Guidance Route

- Layer file: `app/brain/answer_builder.py`

#### Top verified issues

- No critical same-report findings detected.

#### Checked but not detected in this report

- No failed snapraid-sync.service protection failure was detected in this report.

- No SnapRAID data/parity-on-same-physical-disk issue was detected in this report.

- No full host /DATA mounted back as /DATA with published ports was detected in this report.

- No GPU acceleration failure was detected by the current critical rules.

#### Direct answer / severity

- This Flask cockpit currently answers dashboard evidence questions reliably.

- Try: show me dashboard alerts, explain sda CRC errors, why is sdd filesystem usage 100%, which containers are exited, which disks are healthy, or is my system protected?

#### What not to touch

- Do not run docker system prune.

- Do not remove containers in bulk.

- Do not delete /media folders until findmnt verifies whether they are active mounts.

- Do not change Docker bind mounts until the exact source path is verified.

- Do not repair SnapRAID/mergerfs until pool config, parity disk, and data disks are verified.

#### Next safest step

- Ask a dashboard-specific question, or extend the Flask verifier with additional ZimaOS layers.

#### Forum-ready summary

Ask a dashboard-specific question so ZimaBrain can route the answer through the correct verifier layer.

## 2. Show the system drive, its health, temperature and any storage warnings.

Time: 2026-07-13 10:41:23

### ZimaBrain Answer

## :red_question_mark: Question asked

### Show the system drive, its health, temperature and any storage warnings.

#### Verification status

@@VERIFY:VERIFIED@@ :white_check_mark: VERIFIED FROM SAME-REPORT EVIDENCE

- This answer is based on evidence found in the current report.

- Active layer: Disk Health Layer

- Layer file: `app/brain/layers/disk_health.py`

#### Direct answer / severity

- This is a disk health summary question.

Disks needing attention from real values:

- sdd: filesystem usage 100%, health=PASSED, model=TDAS, size=3.6T, mount=/media/CLOUD. Verify the mount and contents before deleting anything.

Info only / unavailable SMART fields:

- No unsupported/N/A SMART values were parsed.

Disks that look OK from available fields:

- sda: health=PASSED, temp=N/A°C, realloc=N/A, pending=N/A, crc=N/A. CRC is the attention item.

#### Next safest step

- Handle real disk warnings first: confirm whether sda CRC errors are increasing, then verify the active sdd mount and contents. Treat NVMe N/A SMART values as unavailable data, not failures.

#### Forum-ready summary

Based on the verified dashboard evidence, the real disk attention items are sda CRC errors and sdd filesystem usage at 100%. NVMe N/A SMART values are informational only. Confirm whether sda CRC is increasing and verify the sdd mount before deleting or replacing anything.

## 3. Are there any active or failed services that need attention?

Time: 2026-07-13 10:42:21

### ZimaBrain Answer

## :red_question_mark: Question asked

### Are there any active or failed services that need attention?

#### Verification status

@@VERIFY:NOT VERIFIED@@ :cross_mark: NOT VERIFIED

- The question did not match a verified diagnostic layer. This answer is guidance only.

- Active layer: Fallback Guidance Route

- Layer file: `app/brain/answer_builder.py`

#### Direct answer / severity

- This Flask cockpit currently answers dashboard evidence questions reliably.

- Try: show me dashboard alerts, explain sda CRC errors, why is sdd filesystem usage 100%, which containers are exited, which disks are healthy, or is my system protected?

#### Next safest step

- Ask a dashboard-specific question, or extend the Flask verifier with additional ZimaOS layers.

#### Forum-ready summary

Ask a dashboard-specific question so ZimaBrain can route the answer through the correct verifier layer.

## 4. Is there any evidence of unusual CPU, memory, swap or disk activity?

Time: 2026-07-13 10:42:46

### ZimaBrain Answer

## :red_question_mark: Question asked

### Is there any evidence of unusual CPU, memory, swap or disk activity?

#### Verification status

@@VERIFY:NOT VERIFIED@@ :cross_mark: NOT VERIFIED

- The question did not match a verified diagnostic layer. This answer is guidance only.

- Active layer: Fallback Guidance Route

- Layer file: `app/brain/answer_builder.py`

#### Direct answer / severity

- This Flask cockpit currently answers dashboard evidence questions reliably.

- Try: show me dashboard alerts, explain sda CRC errors, why is sdd filesystem usage 100%, which containers are exited, which disks are healthy, or is my system protected?

#### Next safest step

- Ask a dashboard-specific question, or extend the Flask verifier with additional ZimaOS layers.

#### Forum-ready summary

Ask a dashboard-specific question so ZimaBrain can route the answer through the correct verifier layer.

## 5. What ZimaOS version and kernel is this system running?

Time: 2026-07-13 10:43:16

### ZimaBrain Answer

## :red_question_mark: Question asked

### What ZimaOS version and kernel is this system running?

#### Verification status

@@VERIFY:VERIFIED@@ :white_check_mark: VERIFIED FROM SAME-REPORT EVIDENCE

- This answer is based on evidence found in the current report.

- Active layer: ZimaOS Update / Regression Layer

- Layer file: `app/brain/layers/zimaos_regression.py`

#### Direct answer / severity

- This is a ZimaOS update / regression verification question.

- The answer comes from the ZimaOS Update / Regression Layer using current dashboard and same-report evidence.

### Version / update evidence

- Host OS: ZimaOS v1.6.2

- Host Version: v1.6.2

- Kernel: 6.18.9

- Uptime: up 2 days, 10 hours, 41 minutes

- RAUC: Compatible: zimaos-zimacube

- Boot cmdline: BOOT_IMAGE=(hd5,gpt4)/bzImage root=PARTUUID=XXXXXXXXXXXXXXXXXXXXXXXXXXXXXXXXXXXX rootwait net.naming-scheme=v250 systemd.machine_id=XXXXXXXXXXXXXXXXXXXXXXXXXXX fsck.repair=yes console=tty1 quiet splash loglevel=3 systemd.show_status=1

#### Next safest step

- Use this version evidence as the baseline. Only run the full regression check if the issue started after an update or paths/apps changed.

#### Forum-ready summary

The running ZimaOS host version, kernel, uptime, RAUC compatibility, and boot command line were checked from same-report host evidence.

## 6. Are there any possible ZimaOS regressions or unusual system services in this report?

Time: 2026-07-13 10:43:31

### ZimaBrain Answer

## :red_question_mark: Question asked

### Are there any possible ZimaOS regressions or unusual system services in this report?

#### Verification status

@@VERIFY:NOT VERIFIED@@ :cross_mark: NOT VERIFIED

- The question did not match a verified diagnostic layer. This answer is guidance only.

- Active layer: Fallback Guidance Route

- Layer file: `app/brain/answer_builder.py`

#### Direct answer / severity

- This Flask cockpit currently answers dashboard evidence questions reliably.

- Try: show me dashboard alerts, explain sda CRC errors, why is sdd filesystem usage 100%, which containers are exited, which disks are healthy, or is my system protected?

#### Next safest step

- Ask a dashboard-specific question, or extend the Flask verifier with additional ZimaOS layers.

#### Forum-ready summary

Ask a dashboard-specific question so ZimaBrain can route the answer through the correct verifier layer.

## 7. Summarise the evidence that would be useful for reporting this issue to IceWhale.

Time: 2026-07-13 10:43:56

### ZimaBrain Answer

## :red_question_mark: Question asked

### Summarise the evidence that would be useful for reporting this issue to IceWhale.

#### Verification status

@@VERIFY:NOT VERIFIED@@ :cross_mark: NOT VERIFIED

- The question did not match a verified diagnostic layer. This answer is guidance only.

- Active layer: Fallback Guidance Route

- Layer file: `app/brain/answer_builder.py`

#### Direct answer / severity

- This Flask cockpit currently answers dashboard evidence questions reliably.

- Try: show me dashboard alerts, explain sda CRC errors, why is sdd filesystem usage 100%, which containers are exited, which disks are healthy, or is my system protected?

#### Next safest step

- Ask a dashboard-specific question, or extend the Flask verifier with additional ZimaOS layers.

#### Forum-ready summary

Ask a dashboard-specific question so ZimaBrain can route the answer through the correct verifier layer.

## 8. Show the nvme0n1 drive, its health, temperature and any storage warnings.

Time: 2026-07-13 10:46:39

## :red_question_mark: Question asked

### Show the nvme0n1 drive, its health, temperature and any storage warnings.

#### Verification status

@@VERIFY:PARTIALLY VERIFIED@@ :white_check_mark: PARTIALLY VERIFIED

- Active layer: SMART / NVMe Health Layer

- Layer file: app/brain/layers/smart_health_layer.py

#### Direct answer / severity

SMART/NVMe evidence does not show confirmed media failure, but warnings, limited SMART visibility, or unverifiable devices were found.

#### Specific disk focus: /dev/nvme0n1

- No CRC counter evidence was parsed for /dev/nvme0n1 in the current report.

- Warning SMART attributes for the disk mentioned in the question:

  • /dev/nvme0n1: NVMe unsafe_shutdowns = 36

#### Critical findings

- None parsed.

#### Warnings / context

- /dev/sdb: Command_Timeout = 2445

- /dev/sdc: Command_Timeout = 13

- /dev/sdc: UDMA_CRC_Error_Count = 213

- /dev/sdc: CRC_Error_Count = 213

- /dev/sde: Command_Timeout = 3

- /dev/nvme0n1: NVMe unsafe_shutdowns = 36

#### Healthy / normal parsed evidence

- /dev/sda: SMART overall-health PASSED

- /dev/sda: Reallocated_Sector_Ct = 0

- /dev/sda: Current_Pending_Sector = 0

- /dev/sda: Offline_Uncorrectable = 0

- /dev/sda: UDMA_CRC_Error_Count = 0

- /dev/sda: CRC_Error_Count = 0

- /dev/sdb: SMART overall-health PASSED

- /dev/sdb: Reallocated_Sector_Ct = 0

- /dev/sdb: Reported_Uncorrect = 0

- /dev/sdb: Current_Pending_Sector = 0

- /dev/sdb: Offline_Uncorrectable = 0

- /dev/sdb: UDMA_CRC_Error_Count = 0

- /dev/sdb: CRC_Error_Count = 0

- /dev/sdc: SMART overall-health PASSED

- /dev/sdc: Reallocated_Sector_Ct = 0

- /dev/sdc: Reported_Uncorrect = 0

- /dev/sdc: Current_Pending_Sector = 0

- /dev/sdc: Offline_Uncorrectable = 0

- /dev/sdd: SMART overall-health PASSED

- /dev/sdd: Reallocated_Sector_Ct = 0

- /dev/sdd: Current_Pending_Sector = 0

- /dev/sdd: Offline_Uncorrectable = 0

- /dev/sdd: UDMA_CRC_Error_Count = 0

- /dev/sdd: CRC_Error_Count = 0

- /dev/sde: SMART overall-health PASSED

- /dev/sde: Reallocated_Sector_Ct = 0

- /dev/sde: Reported_Uncorrect = 0

- /dev/sde: Current_Pending_Sector = 0

- /dev/sde: Offline_Uncorrectable = 0

- /dev/sde: UDMA_CRC_Error_Count = 0

#### Next safest step

Collect complete host SMART/NVMe evidence before replacing disks or creating RAID/ZFS:

```bash

for d in /dev/sda /dev/sdb /dev/sdc /dev/sdd; do echo “===== SMART $d =====”; smartctl -H -A “$d” 2>&1 | sed -n ‘1,140p’; done

for n in /dev/nvme0n1 /dev/nvme1n1 /dev/nvme2n1 /dev/nvme3n1; do echo “===== NVME $n =====”; nvme smart-log “$n” 2>&1 | sed -n ‘1,90p’; done

```

#### Safe recommendation

Do not call a drive fully healthy from SMART PASSED alone. Check reallocated sectors, pending sectors, offline uncorrectable sectors, CRC errors, NVMe critical warnings, media errors, unsafe shutdowns, and error log entries. If detailed SMART attributes are N/A or missing, treat health as only partially verified. RAID, SAS/HBA, USB bridge, or controller passthrough can hide SMART detail.

#### Forum-ready summary

SMART/NVMe health should be verified from host evidence. PASSED is useful, but it is not enough by itself. If detailed SMART attributes are unavailable or N/A, treat the result as limited visibility, not confirmed healthy and not confirmed failed. Review critical attributes, controller passthrough, and NVMe error fields before deciding a disk is healthy or safe for RAID/ZFS.


Thanks for taking the time to run ZimaBrain CE and export the full session. This is very useful feedback.

It correctly verified the ZimaOS version, kernel and SMART/NVMe evidence, but it did not yet connect the repeated disk activity to the active zimaos-welcome service. The questions about active services, unusual CPU or disk activity and regression reporting also fell back to the general guidance route.

We will add this case to the next ZimaBrain CE release, including better active-service checks, disk activity evidence and service-specific detection for issues like this.

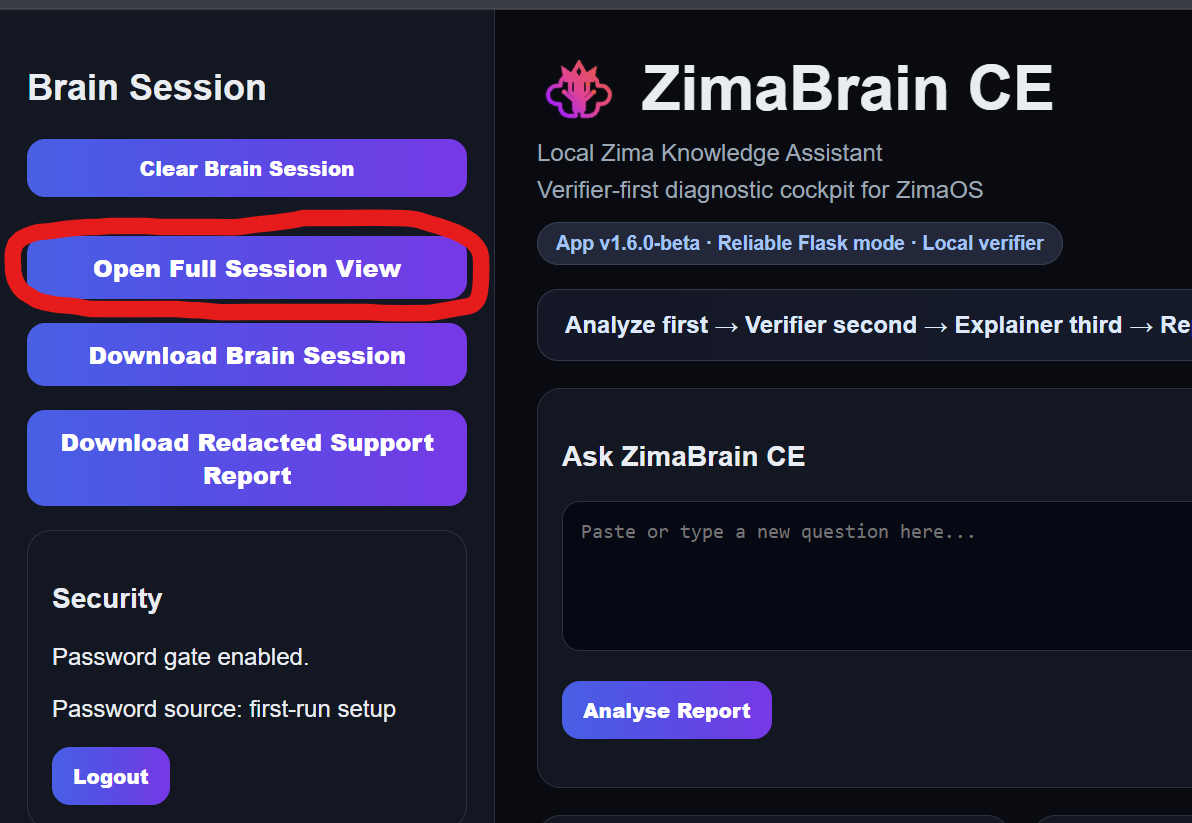
For future reports, after finishing your questions, click Open Full Session View as shown in the screenshot. From there, you can review the entire session before exporting it.

You can then use:

Download Brain Session

to download the complete conversation, including every question, answer, verification status and evidence summary.

For public forum posts, I suggest using:

Download Redacted Support Report

This removes or masks sensitive system information before sharing. Please still review the file before posting it publicly.

Your exported session has given us exactly the evidence needed to improve these layers. Thanks again for testing it properly and showing both what it found and what it missed.

Glad I could be of any assistance, if you need anything testing in the future you know where to find me :slight_smile:

And thank you for helping to pinpoint what is causing this weird behaviour in my system, i do hope that zima team will figure it out. For now I will leave zimaos-welcome inactive, will keep monitoring and will wait for an update on the issue.