Just updated to ZimaOS 1.4.0 on my Zimacube. Seems there is a CPU bug. My CPU % jumps around constantly. 3-9%. Two versions ago there was some type of bug that would slowly increase the CPU usage over time. I would have to restart once a week to bring it down. Now, with nothing running, the CPU jumps every second. Has anyone else experienced this?
Thanks for your feedback.
With the updating of the OS, more and more services/functions are added and running in the background.
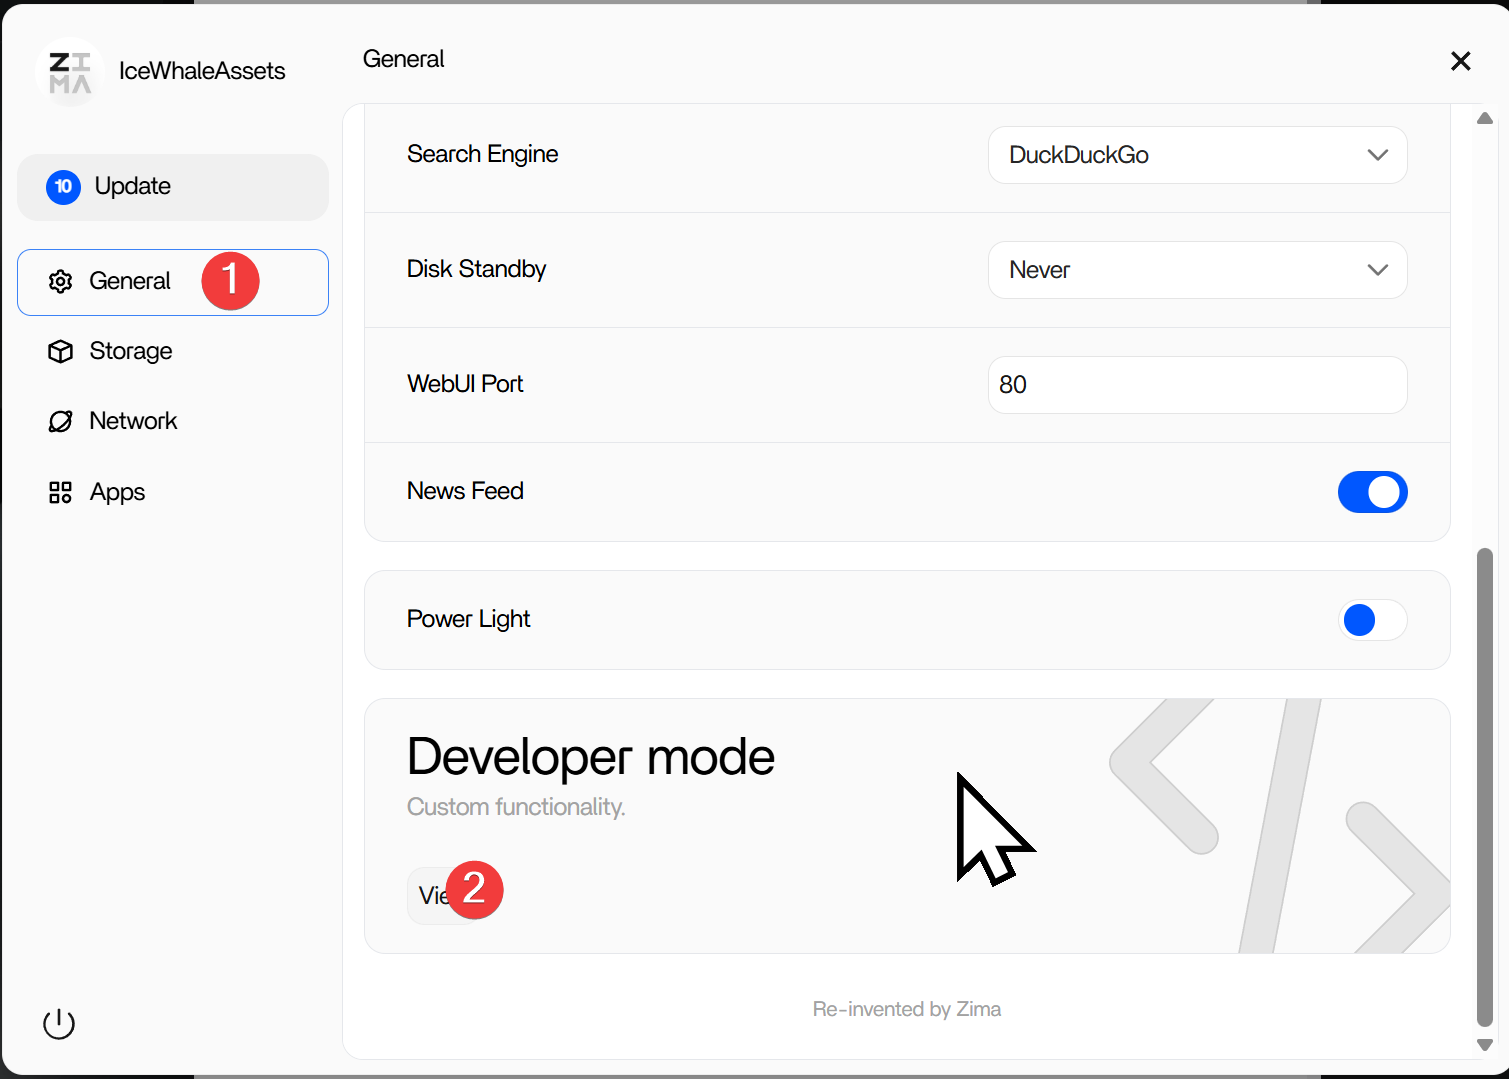
If you care much about the CPU usage, you can turn off some of them in the settings panel. Especially here:
However, we still encourage you to use most of our functions.
Simply removing the CPU visual is not a fix for the bug introduced with this version. I am also not able to see my drives anymore when using the network path and IP of my Zimacube. Using the hostname does show the drives. I would like the bug fixed and not have to remove visuals.
They clearly just said that there are services that run in the background and then explained how to disable some of them. The search service scans and indexes at intervals. It’s not a bug, its doing what its supposed to do. You can turn it off if you like.
You’re right and that is my bad, however, I turned off search services and the CPU constantly bouncing has remained.
If you think your issue is problem-related, I would like to invite you to post this problem in corresponding channel.
https://community.zimaspace.com/new-topic?category_id=33&tags=problem-opened
We can share screenshots and screen records better there with our engineers to locate the issue.
Would you?
1 Like
I have exactly the same problem. ZimaOS v1.4.0 on Zimaboard 832. Constant CPU spikes up to 30%, even if i just run only wireguard, no other docker containers active.
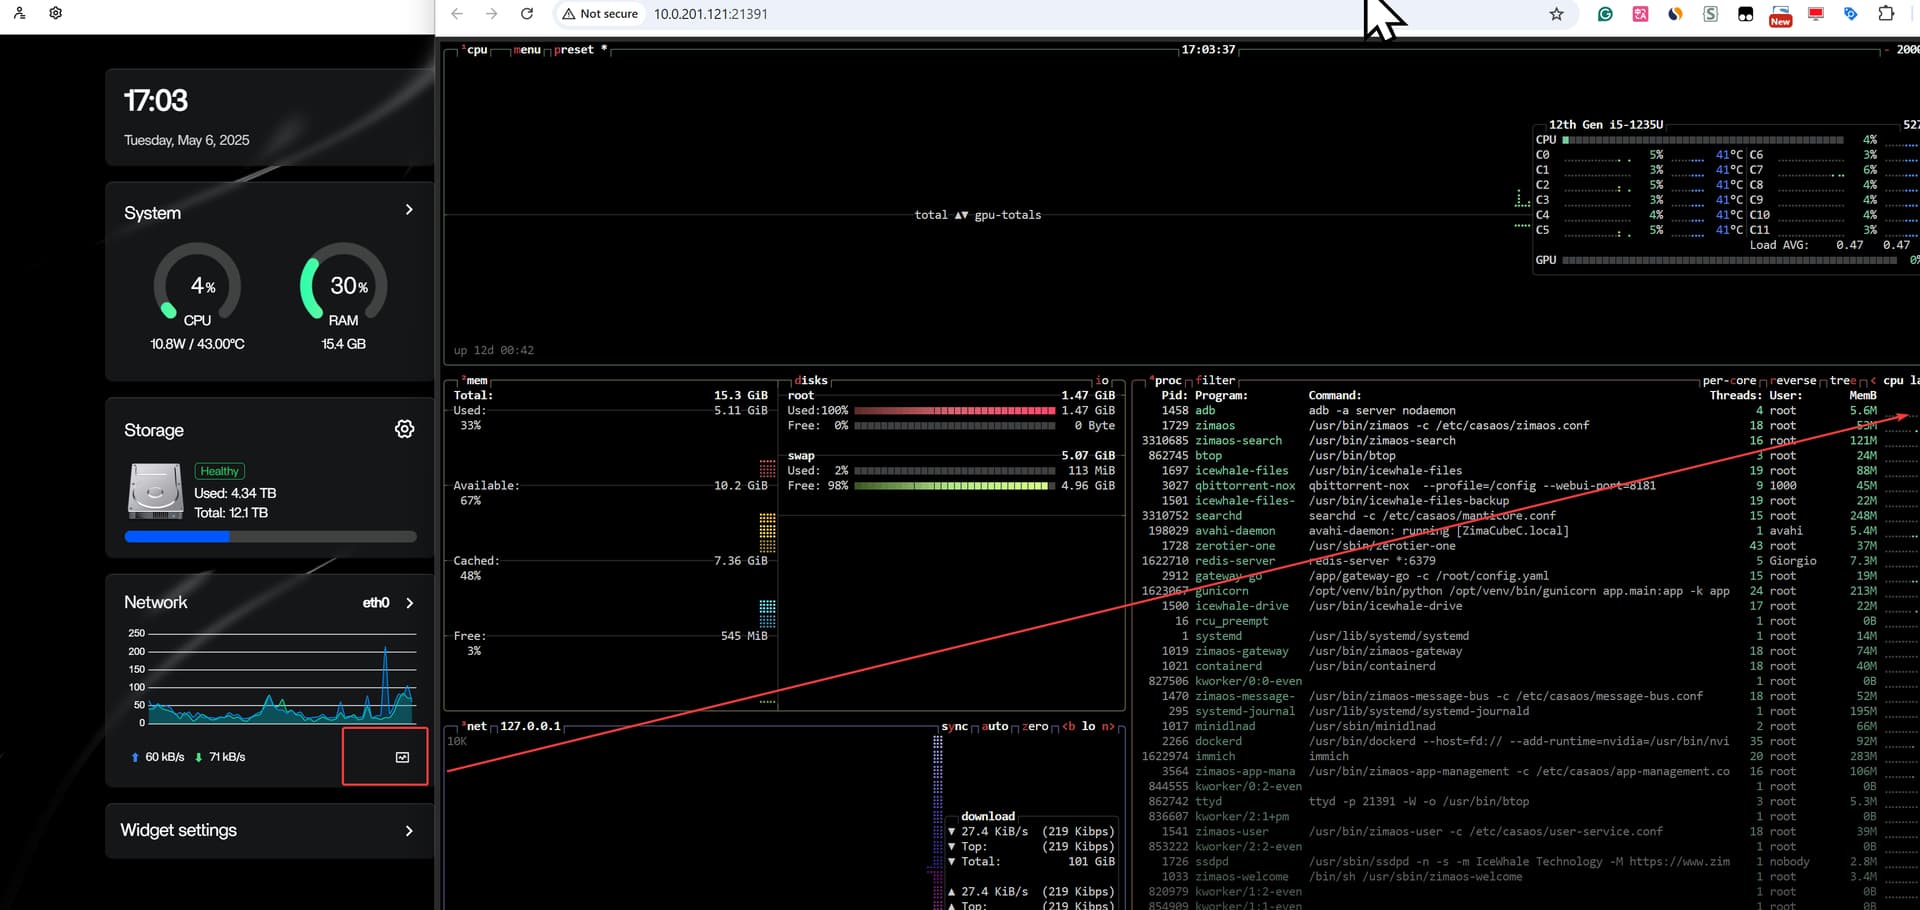
This is my btop output. Please also notice the network spikes without any reason. i didnt have those before the update to v 1.4.0. Thank you.
@aiku
10kB/s is not considered a big traffic. Will this belong to WireGuard?
Try to shut that down as well.
And if you care much about the outgoing traffic, you can use some tools from here to analyze it:
About the usage of CPU. Would you please record the screen with both the UI of dashboard and the btop for over 1 minute?
These two displays of CPU usage have different sampling frequency, which might be the cause.
1 Like
Please see my attachment here:
Checked your video. These two displays seem to have equal validity.
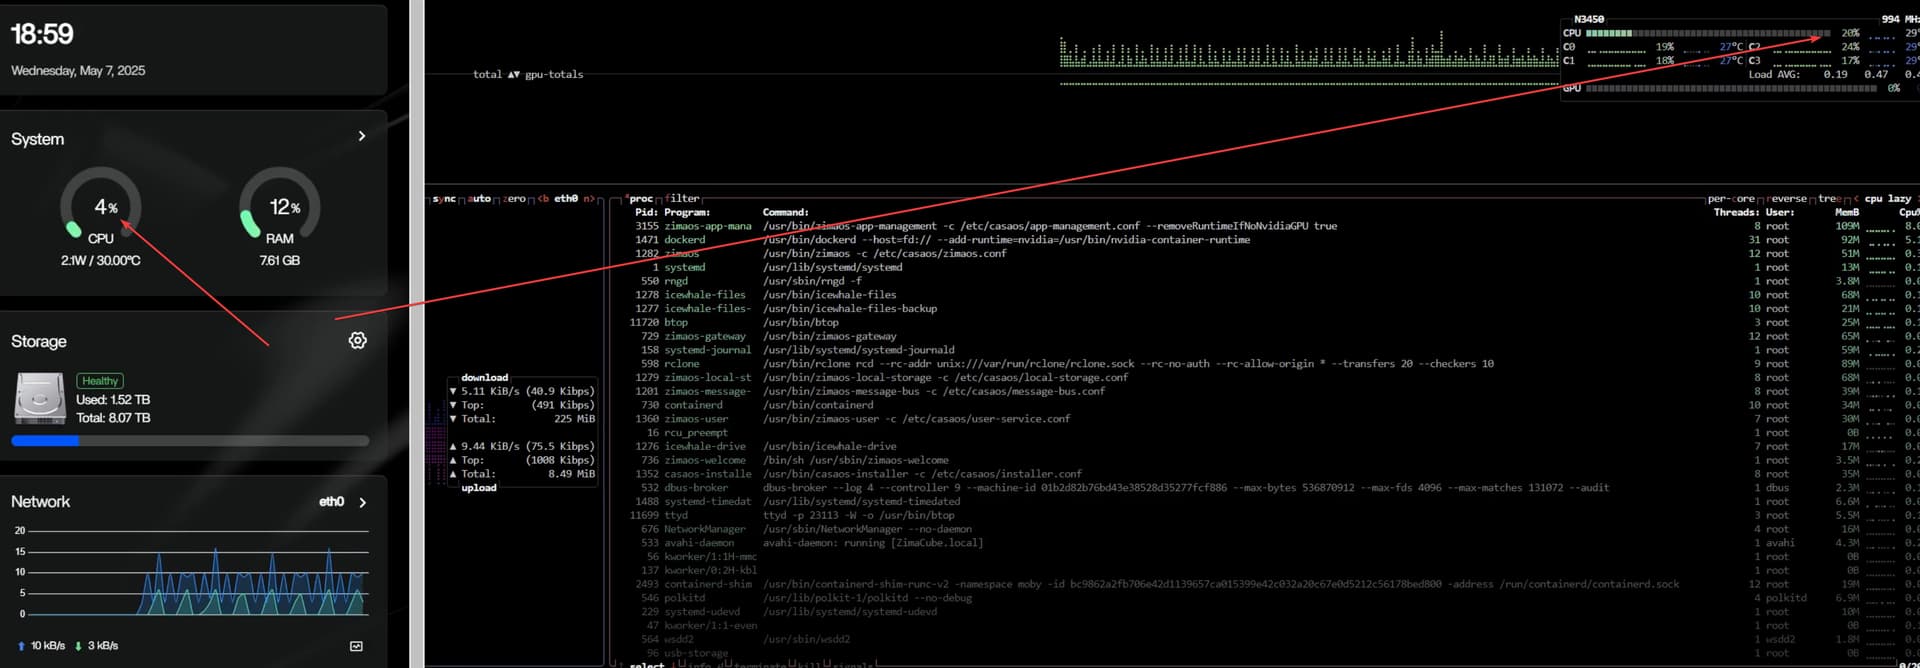
As I said, these two displays of CPU usage have different sampling frequencies, which might be the cause.
And this is from our engineer: we did not add system service in 1.4.0. And they will check if the usage of app-management is an issue.
1 Like
Hi, the app management’s CPU usage issue has been located. And it will be fixed. Thanks for your feedback.
1 Like
Thank you very much, you guys are awesome!
And if convenient, could you please run top in CLI to locate possible apps/services with high CPU usage?
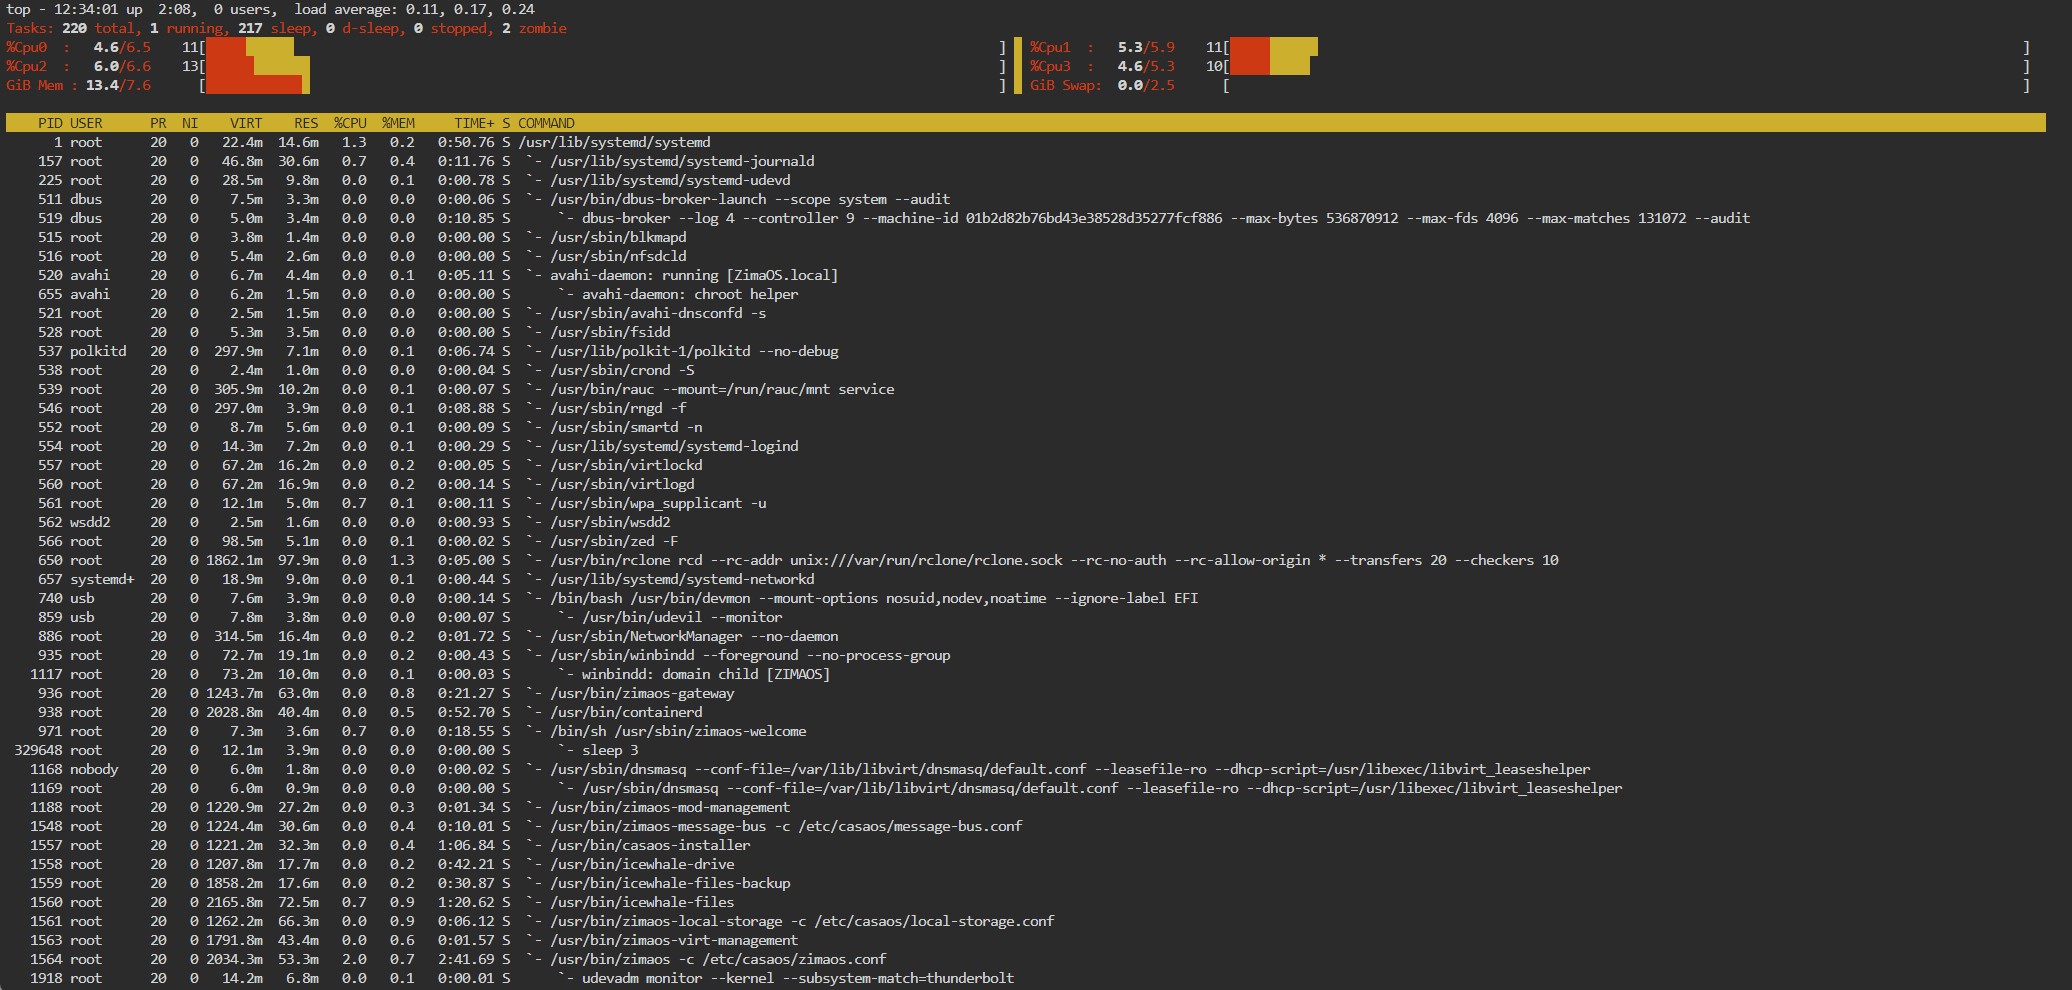

Press P(in upper case) in the UI of top to make the CPU usage order the process list. And try to locate the possible high-usage process. And by the way, what is your CPU model?
Also, remember to upgrade to 1.4.1 beta2. It imporves the performance of some services.
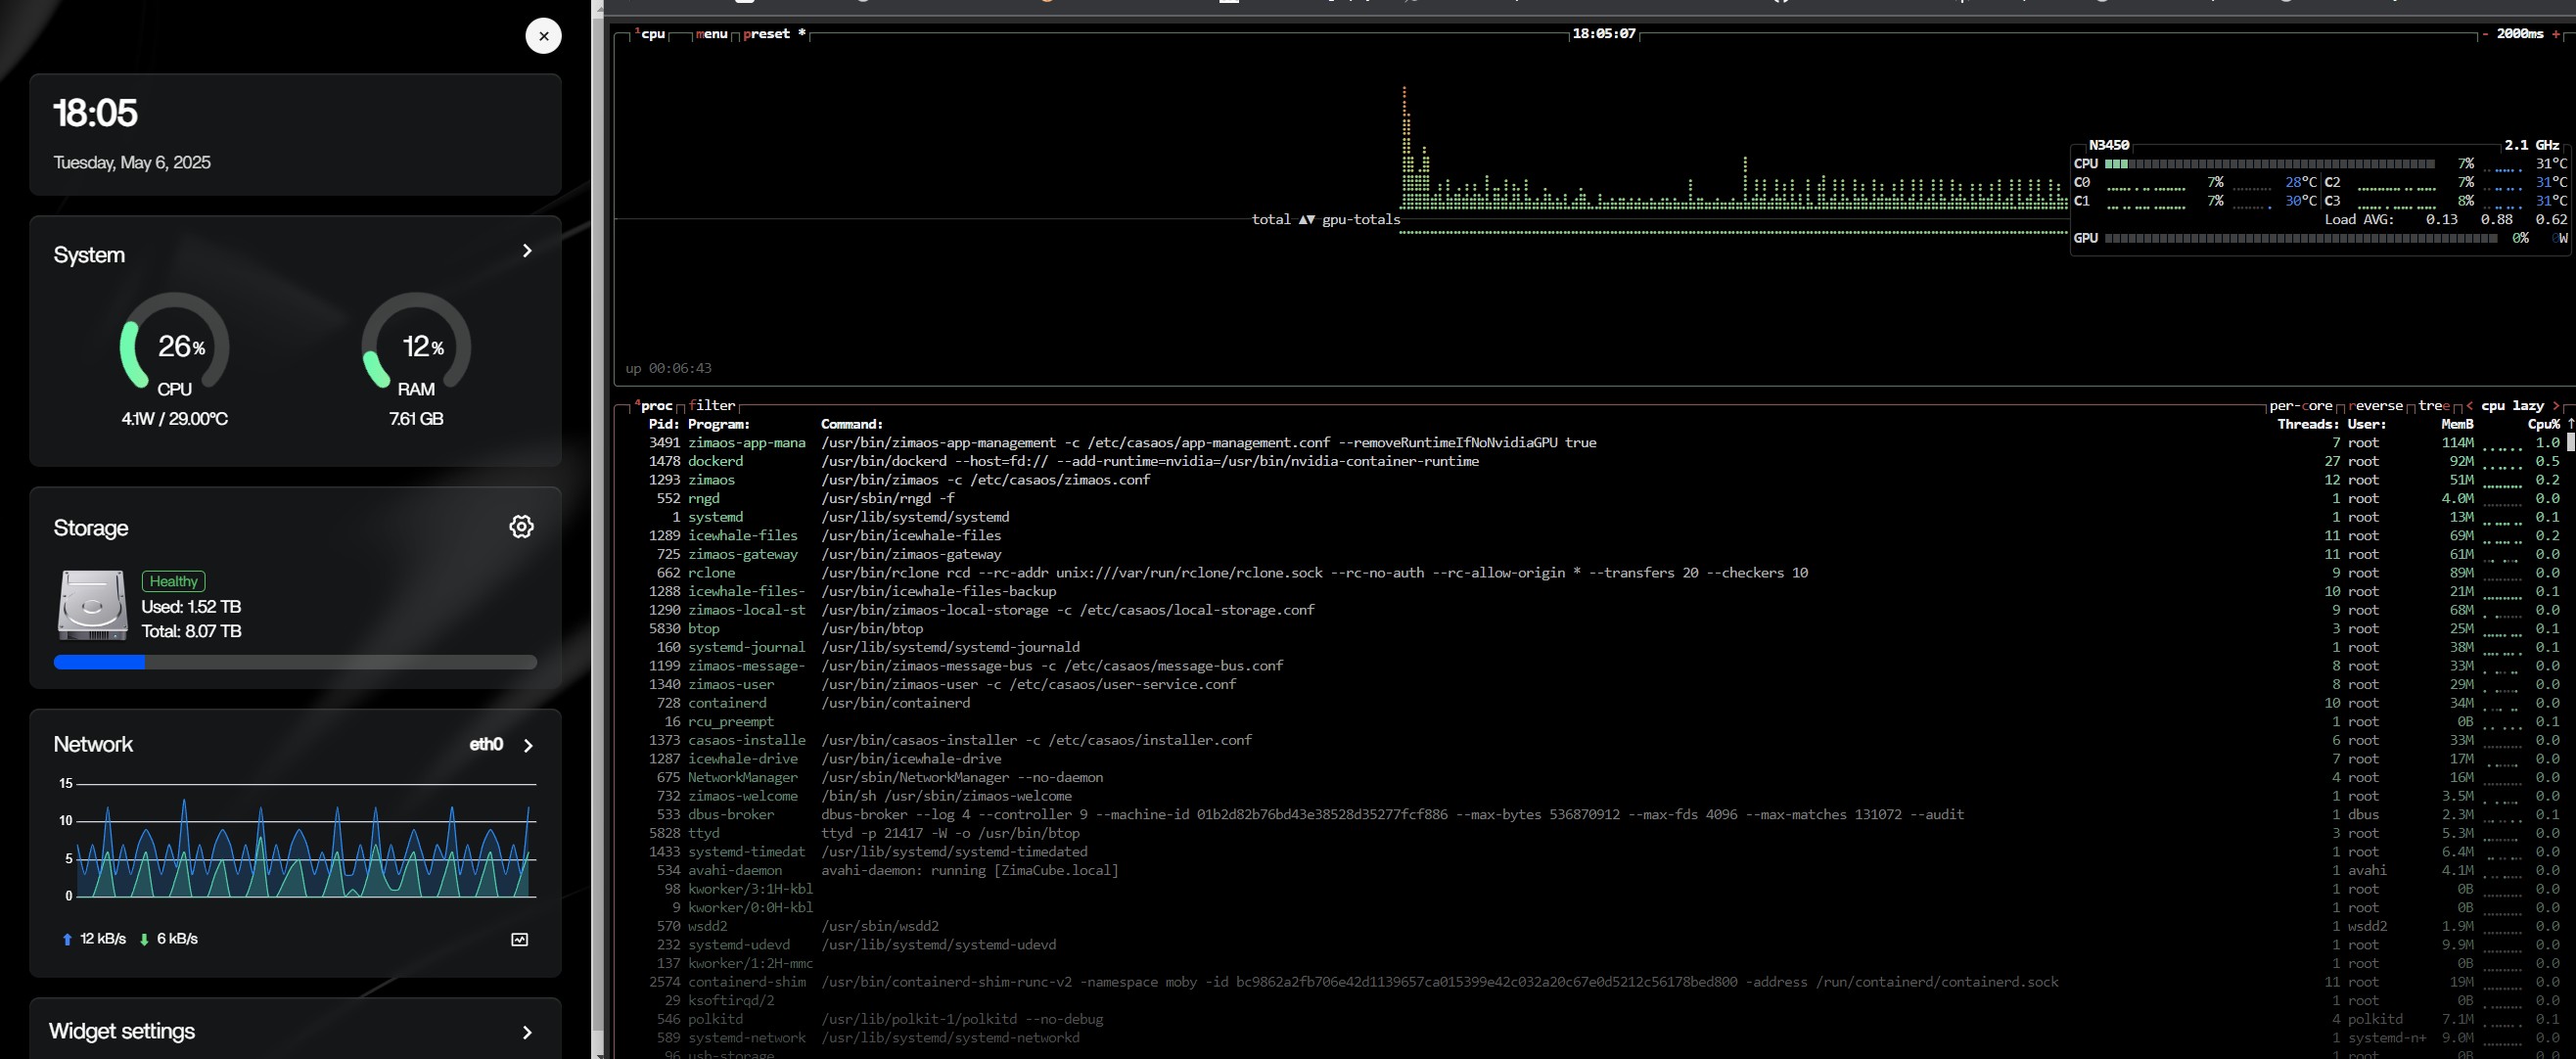
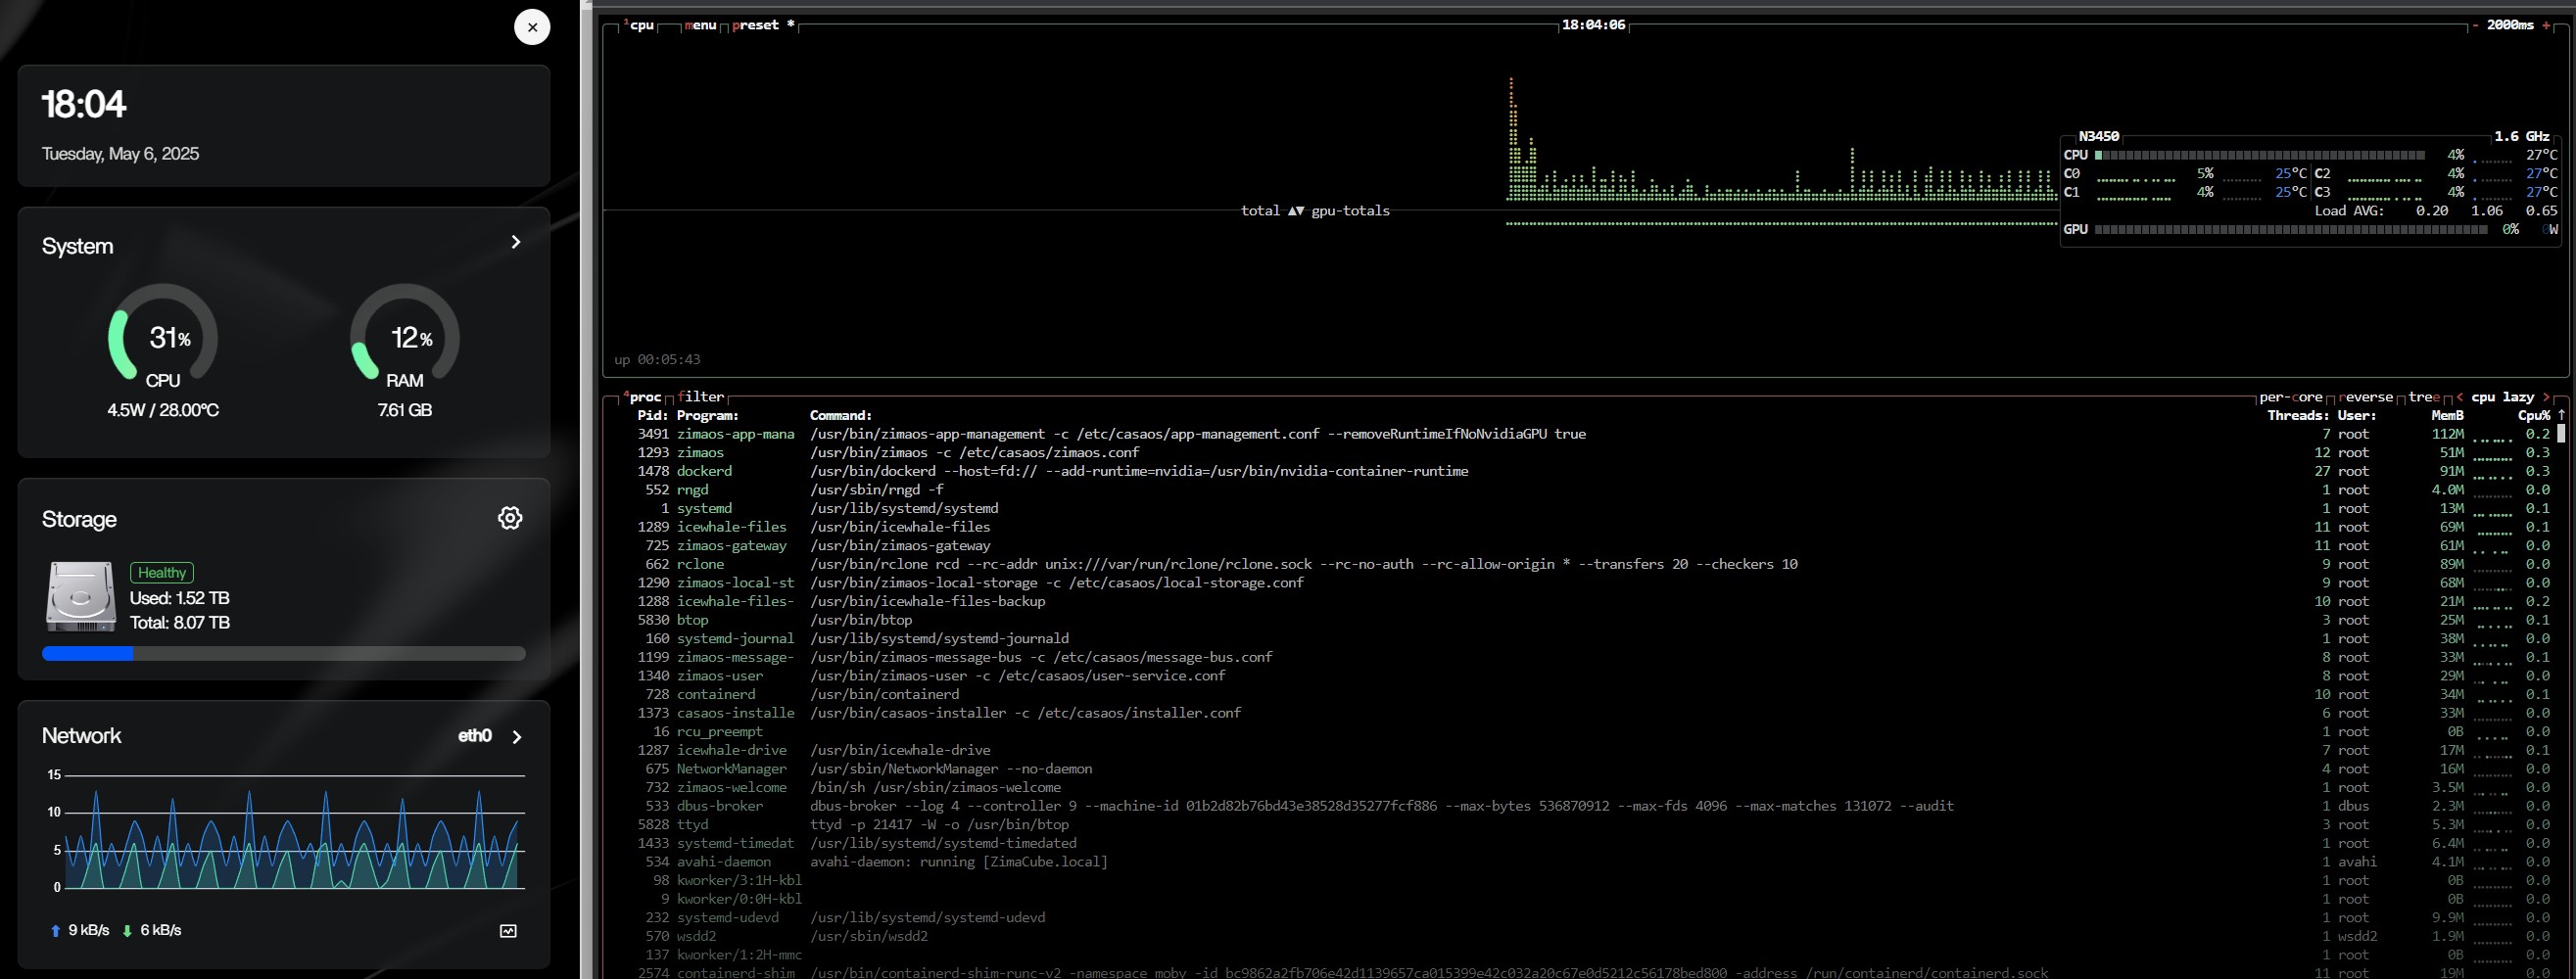
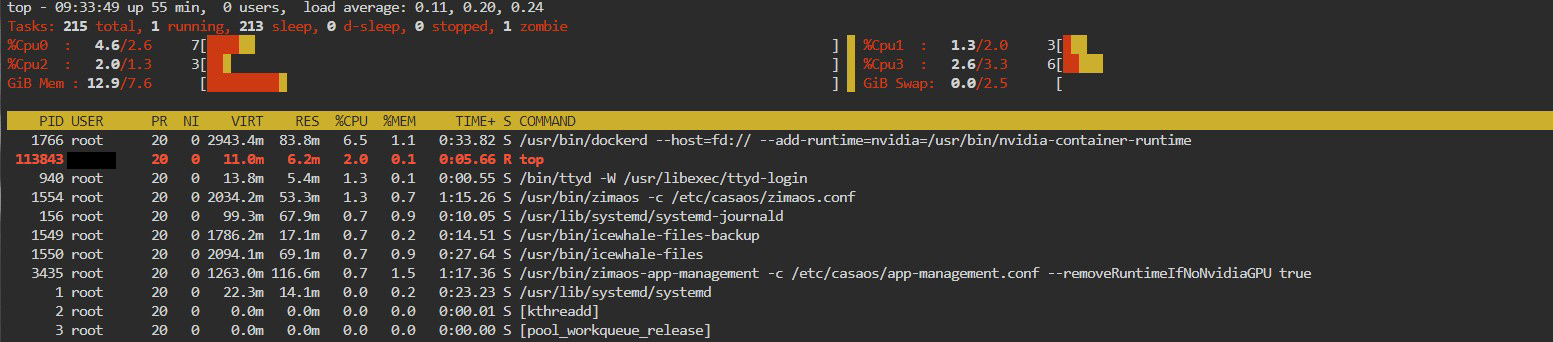
I updated to 1.4.1 beta2. My CPU Model is Intel Celeron N3450 @ 1.10 GHz.
The CPU peaks have improved significantly, but they’re still present. Values range between 5% and 10% utilization, changing every second. I have identified nvidia-container-runtime and zimaos-app-management as the service that might be responsible for these peaks. Thank you for your help.
1 Like