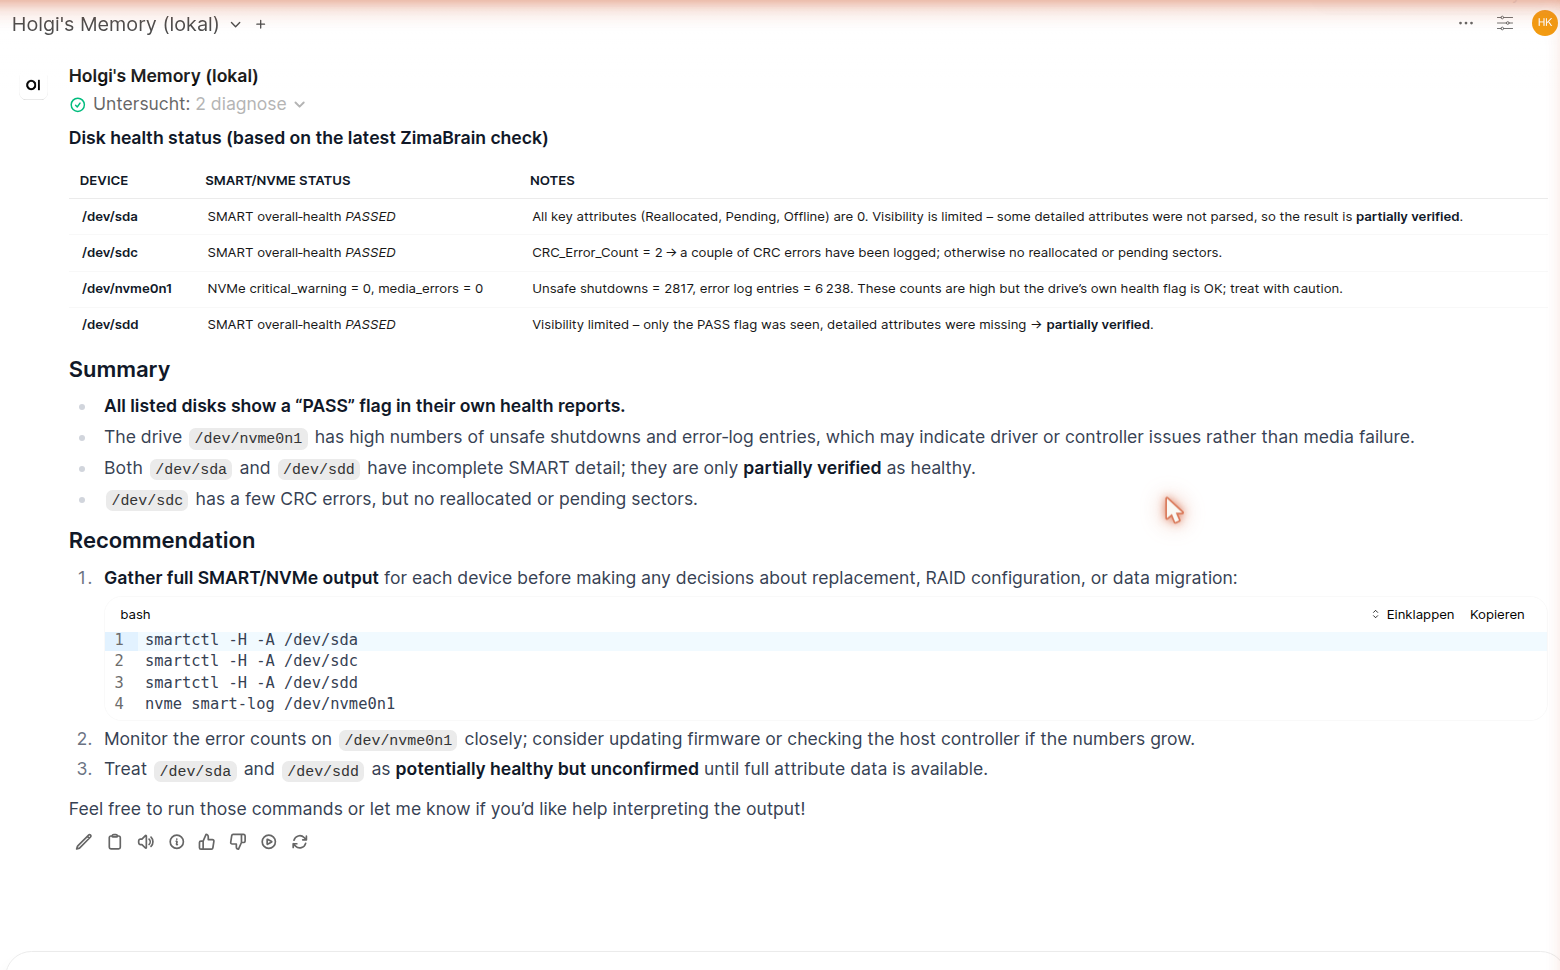
@Gelbuilding The next step is coming ………it’s up and running but still in early Beta ……… And the best part is, **ZimaBrain will be part of a local memory layer **
Everything is running locally - totally cloud free if you want
Open WebUI - asked for Disk Health Status
more details are coming …………
1 Like
Holger, thank you again for your guidance and for sharing this publicly.
Your work around the local memory layer, Open WebUI and the wider architecture is exactly the direction ZimaBrain needs. It ties in naturally with what we have been building and could help bring the wider vision together.
More importantly, your advice has helped shape the project well beyond individual features. The separation between the brain, memory, tools and interface is a much cleaner and more scalable approach.
Your willingness to share your knowledge with the community should be commended. It is people like you who help move projects forward and make the entire ZimaOS ecosystem stronger.
I am genuinely excited about what comes next and sincerely appreciate the time and expertise you have shared with all of us.
BUG: On following setup instructions . {Failed to pull image after trying 4 different mirror methods. If this is a private image, verify registry credentials and pull permissions}
Im pretty sure im missing something in the instructions that does not line up . example { Paste the compose file below into Custom App and deploy it.} there is no obvious place for that to be pasted into . also it does not refer to adding the docker image . . . . what info goes where? or to put it an other way
GitHub only contains the installation instructions and the Compose file. You do not download or manually add the Docker image.
In ZimaOS:
- Open App Store.
- Select Custom Install.
- On the Custom App page, select Import in the top-right corner.
- Copy the complete Compose block from GitHub and paste it into the Compose import box.
- Select Import, then deploy the app.
The image: entry inside the Compose file tells Docker which image to download automatically.
If you still receive the pull error, please provide a screenshot showing the complete image name and error. The mirror message alone does not identify the actual cause.
Hi everyone,
A substantial ZimaBrain CE beta update is now available in the normal Docker / Custom App version.
This update took longer than expected because I did not want to patch only the individual questions reported by testers. The aim was to improve the wider diagnostic areas so that different wording and similar questions are handled consistently.
Thank you to everyone who tested ZimaBrain, shared reports, and pointed out where the answers were weak, slow, repetitive, or missing important system context.
The updated Docker image is:
gelbuilding/zimabrain-ce:1.6.0-beta
GitHub:
Local memory has now been added
One of the biggest additions is persistent local question memory.
ZimaBrain now remembers evidence-based conclusions in its local SQLite database. If a user repeats or rewords a question, ZimaBrain can match it to the same diagnostic subject and compare it with the previous result.
For example, these questions are treated as the same subject:
Is memory pressure high?
Am I running out of RAM?
Do I have enough available memory?
ZimaBrain can now explain whether:
- The question is using the same system snapshot
- A newer health scan is available
- The conclusion is unchanged
- The condition has improved or worsened
- The verification state has changed
- A previous warning has recovered
- A problem is new, persistent, or historical
Small normal changes, such as a few MiB of RAM or a minor temperature variation, should not incorrectly report that the whole conclusion changed.
The memory stays locally on the ZimaOS device. Password, token, secret, and API-key patterns are redacted before question-memory content is stored.
Comprehensive system-health assessment
A new comprehensive health layer combines the current system report with the local health timeline.
It can check:
- Failed or degraded systemd services
- Running, exited, restarting, and unhealthy containers
- Elevated container configuration settings
- CPU, memory, swap, load, and temperature
- SMART and NVMe health evidence
- Read-only mounts and missing storage paths
- DNS, gateways, routes, and network interfaces
- Published and listening services
- Tailscale running on the host or in Docker
- Changes since earlier health scans
- Recovered and persistent faults
The answer separates current verified problems from historical warnings and incomplete evidence.
Better memory-pressure answers
Memory questions now receive a focused memory answer.
ZimaBrain reports:
- Total and used RAM
- Available RAM
- Available-memory percentage
- Swap capacity and current usage
- Normal, elevated, or high memory pressure
- A memory-specific next step
It no longer fills a simple memory answer with unrelated CPU and temperature advice.
Better container diagnostics
Container checks now include:
- Running containers
- Exited or stopped containers
- Restarting containers
- Unhealthy containers
- Restart counts
- Published ports
- Bind mounts
- Host networking
- Privileged mode
- Docker socket access
- Host PID namespace
- Device access
- Other elevated settings
An elevated setting is reported as configuration context. It is not automatically called a fault unless the evidence supports that conclusion.
Better failed-service checks
Failed-service answers now use current systemctl --failed evidence and can identify the exact failed unit.
ZimaBrain does a better job of separating:
- A current outage
- A historical boot failure
- A failed helper or watchdog service
- A missing executable or path
- An obsolete local service
- A container-name mismatch
- A possible ZimaOS packaging regression
Better network diagnostics
Network diagnostics now inspect:
- IPv4 interfaces
- Interface state
- Default gateways
- Route metrics
- Route selection
- DNS servers
- DNS resolution
- Multiple default routes
- Possible routing conflicts
- Published container ports
- Localhost-only services
- LAN-reachable services
- Tailscale host or container installations
Multiple interfaces or multiple routes are not automatically classified as a fault. ZimaBrain checks the active route, gateway, interface state, and metrics first.
SMART, NVMe, storage, and update history
ZimaBrain can now give focused answers about:
- SMART values becoming worse
- NVMe counters increasing
- Historical CRC values
- Unsafe shutdown history
- Read-only storage
- Missing AppData or media paths
- Container and service history
- Changes after a ZimaOS update
- Previous faults that have recovered
SMART scan timestamps and other scan metadata are ignored during semantic comparison. A new scan timestamp alone should not make ZimaBrain claim that disk health changed.
Suggested questions have been added
A suggested-question selector is now available in the interface.
This should help users who know something is wrong but are unsure what to ask.
Example questions include:
Give me a complete system-health assessment.
What should I check first?
What changed since my previous scan?
Is memory pressure high?
Have any SMART values become worse?
Which services are failed or degraded?
Which containers are stopped or unhealthy?
Are any containers misconfigured?
Are my disks healthy?
Are there DNS or routing problems?
Are multiple network interfaces causing routing conflicts?
Which services are listening on the network?
Is Tailscale functioning correctly?
Are any storage mounts read-only?
What changed after my latest ZimaOS update?
Why is Immich not starting?
Users can still type their own questions. A question mark is not required.
Other fixes
This update also includes:
- Faster responses to repeated questions
- A short evidence cache to avoid unnecessary repeated scans
- Better Verified, Partially Verified, and Not Verified handling
- Better routing across diagnostic areas
- Improved app installation guidance
- Verified app profiles separated from generic installation checklists
- Better read-only storage assessment
- More focused timeline answers
- Database-safe regression testing
- The new ZimaBrain logo on the app tile and browser tabs
- Favicon support on login, setup, dashboard, answer, and session pages
Updating or reinstalling
If you have an older ZimaBrain test container, remove it and pull the updated image:
docker rm -f zimabrain-ce-flask-8601 zimabrain-ce 2>/dev/null || true
docker pull gelbuilding/zimabrain-ce:1.6.0-beta
Removing the container does not remove the persistent ZimaBrain data stored under:
/DATA/AppData/zimabrain-ce
Install ZimaBrain through:
ZimaOS → App Store → Custom App
Paste the complete compose file below into Custom App.
name: zimabrain-ce

services:
  zimabrain-ce:
    image: gelbuilding/zimabrain-ce:1.6.0-beta
    pull_policy: always
    container_name: zimabrain-ce
    restart: unless-stopped
    privileged: true
    pid: host
    network_mode: bridge

    ports:
      - target: 8601
        published: "8601"
        protocol: tcp

    volumes:
      - type: bind
        source: /DATA/AppData/zimabrain-ce
        target: /data

      - type: bind
        source: /DATA/AppData/zimabrain-ce/docs
        target: /app/docs
        read_only: true

      - type: bind
        source: /proc
        target: /host/proc
        read_only: true

      - type: bind
        source: /sys
        target: /host/sys
        read_only: true

      - type: bind
        source: /etc/hostname
        target: /host/etc/hostname
        read_only: true

      - type: bind
        source: /var/run/docker.sock
        target: /var/run/docker.sock
        read_only: true

    labels:
      icon: https://raw.githubusercontent.com/Jacko88888/zimabrain-ce/main/app/assets/zimabrain-ce-logo.png

networks:
  default:
    name: zimabrain-ce_default

x-casaos:
  architectures:
    - amd64
  author: gelbuilding
  category: Utilities
  developer: gelbuilding
  hostname: ""
  icon: https://raw.githubusercontent.com/Jacko88888/zimabrain-ce/main/app/assets/zimabrain-ce-logo.png
  index: /
  is_uncontrolled: false
  main: zimabrain-ce
  port_map: "8601"
  scheme: http
  store_app_id: zimabrain-ce

  description:
    en_us: Local ZimaOS diagnostic assistant with verifier-first evidence checks.

  tagline:
    en_us: Local ZimaOS diagnostic assistant

  title:
    custom: ZimaBrain CE
    en_us: ZimaBrain CE
After installation:
- Open the ZimaBrain CE tile.
- Set the first-run password if this is a new installation.
- Choose a suggested question or type your own.
- Repeat or reword a question to test the local memory.
- Run another health scan later and ask the question again to compare results.
- Export the redacted session if you want to share the results here.
Note for ZimaOS 1.7 testers
ZimaOS 1.7 may briefly show a Redirecting to app launch screen before opening ZimaBrain. I have also seen this with other apps, so it appears to be part of the ZimaOS 1.7 app-launch behaviour rather than a ZimaBrain-specific screen.
ZimaBrain CE is still beta, and I would appreciate testing of:
- Repeated and reworded questions
- Memory comparison between scans
- Comprehensive system health
- Memory pressure
- Failed services
- Container configuration
- DNS and routing
- Tailscale
- SMART and NVMe trends
- ZimaOS update comparisons
Please post any incorrect or weak answers here, preferably with a redacted exported session, so the evidence and routing can be reviewed properly.
1 Like
This is the best overall system-health assessment I have seen so far.
The new local memory layer makes a big difference because historical values are now recognised correctly instead of being reported as new warnings every time.
I especially like:
-
Historical comparison
-
Honest limitations
-
“What not to touch”
-
Previous answer comparison
-
Stable CRC/NVMe reporting
The overall structure is much clearer than before.
I only have a few small suggestions:
-
Explain that failed watchdog/helper services are not necessarily system failures.
-
Explain high swap usage together with available RAM.
-
Explain why exFAT is only a warning.
-
Consider adding a small colour-coded health summary (CPU, Memory, SMART, Services, Storage, Network) at the top for a quicker overview.
I found another point while testing the new memory layer.
I asked:
“What has changed since the previous scan?”
The answer is very detailed, but I think the wording is a little misleading.
The title suggests that ZimaBrain is comparing the current report with a previous one.
However, later in the answer it correctly states:
“This v1 layer does not yet compare against an older saved report.”
So, at the moment it is actually creating a baseline rather than showing what has changed.
I think the response could be clearer.
For example:
No previous baseline available.
This report has been saved as the initial baseline.
Run another health scan later and ask the same question again to see what has changed.
Once a previous baseline exists, the answer could then become:
Changes since previous scan
 No new failed services
CRC values unchanged
 One new container stopped
Memory pressure improved
I think this would better match the user’s expectation when asking “What has changed since the previous scan?”
1 Like
Thank you, this is very useful feedback, and I appreciate you testing the answers properly rather than only checking whether the page loads.
I agree with all four suggestions.
A failed watchdog or helper should not automatically be presented as a system failure when the main main service is active and healthy.
Swap also needs context. High swap usage by itself does not prove current memory pressure if sufficient RAM remains available. The answer should explain both together.
The exFAT warning should explain that exFAT lacks native Linux ownership, permission and journaling features. It is configuration context, not proof that the disk or filesystem is failing.
A compact health summary for CPU, memory, SMART, services, storage and network would also make the detailed assessment much easier to scan.
You also found a genuine gap with “What has changed since the previous scan?” The new timeline memory exists, but this wording is still reaching the older report-comparison layer.
I will connect that route to the new timeline comparison and make the behaviour explicit:
No previous baseline available.
This scan has been saved as the initial baseline.
Run another health scan later and ask again.
After a second scan, it should report actual changes, unchanged historical values, improvements and new problems. I will add regression tests for the initial baseline, an unchanged comparison and a genuinely changed scan before considering this part finished.
This answer is much cleaner than before, but I think one important piece of context is still missing.
The question is:
“Which services are failed or degraded?”
The answer correctly lists the two failed units:
-
tailscaled-watchdog.service
-
zfw-ui-watchdog.service
However, both are watchdog/helper services.
I think ZimaBrain should immediately verify the related primary services and include the result.
For example:
tailscaled-watchdog.service
-
Helper/watchdog unit failed.
-
Primary service (
tailscaled.service): Running and healthy. -
No current Tailscale outage detected.
zfw-ui-watchdog.service
-
Helper/watchdog unit failed.
-
Primary service (
zfw-ui.service): Running and healthy. -
No current firewall UI outage detected.
That would answer the user’s actual question much better, because they immediately know whether something is genuinely broken or whether only a helper unit failed during boot.
If the primary service is also failed, then the severity should remain higher.
I think this question exposes another routing gap.
I asked:
“Are any required ZimaOS helper files missing?”
The answer correctly accepted the custom question, but it did not actually answer it.
Instead, it listed a few active services.
I would expect ZimaBrain to inspect the failed units and verify whether the executable or helper file referenced by the service actually exists.
For example:
-
Does
ExecStart=point to a missing executable? -
Is a required helper script missing?
-
Does the journal contain “No such file or directory”?
-
Could this indicate a ZimaOS packaging regression?
In my earlier case, ZimaBrain should have recognised that:
/usr/libexec/targetcli-sync-users
was missing and linked it to the failed helper service.
If no missing helper files are detected, I would expect an explicit answer such as:
No missing required helper files were verified from the current evidence.
rather than simply listing active services.
Thank you, this is excellent testing. You have identified two genuine functional gaps rather than simple wording problems.
For failed watchdog and helper services, ZimaBrain needs to immediately check the related primary service. It should not make the whole system appear unhealthy because a watchdog failed during boot while the service it monitors is currently active.
The answer should clearly separate:
Helper/watchdog failure
Related primary service
Current primary-service state
Whether a current outage is indicated
Appropriate severity
If the helper failed but the primary service is active, the severity should be reduced. If both failed, the severity should remain high. If the primary-service evidence is unavailable, ZimaBrain should say that confirmation is still required.
Your missing-helper-file example also exposed a routing gap. That question should not fall into the generic custom-question layer.
ZimaBrain needs to inspect failed units and verify:
ExecStart
ExecStartPre
ExecStartPost
Referenced executable and script paths
Recent journal file-not-found messages
status=203/EXEC failures
Executable permissions
It should then distinguish between a missing ZimaOS-managed helper, a missing user script under /DATA, a permission problem, and a broken local configuration. A missing file under /usr/libexec may indicate a possible ZimaOS packaging regression, but it should not be called confirmed without enough evidence.
If no missing helpers are found, the answer should explicitly say:
No missing required helper files were verified from the current failed-unit evidence.
This also needs to connect to the local memory layer so ZimaBrain can show whether a helper failure or missing file is new, persistent, historical, or recovered after an update.
I will implement this as a general failed-service correlation and executable-verification improvement, not as a special fix only for Tailscale, ZFW, or targetcli-sync-users. I will also add regression tests for helper-only failures, primary-service outages, missing system helpers, missing /DATA scripts, 203/EXEC, unavailable evidence and recovered conditions.
Thank you again. This is exactly the level of testing needed to make the verifier genuinely useful.
1 Like
Isanto1306,
thank you again for the detailed and constructive feedback. Your examples directly helped shape this update.
ZimaBrain can now recognise when a failed systemd unit is a watchdog, monitor or helper and automatically inspect the related primary service. It reports the helper failure, the primary-service state, whether a current outage is indicated, the appropriate severity, and whether any evidence is incomplete.
It also now checks failed units for missing or unusable executables referenced by ExecStart, ExecStartPre and ExecStartPost. This includes file existence, executable permission, 203/EXEC failures, recent “No such file or directory” journal evidence and the unit’s FragmentPath.
The answer distinguishes between a missing ZimaOS-managed helper, a missing local script under /DATA, an existing file without executable permission, and a broken or stale local service configuration. A missing system helper may be reported as a possible ZimaOS packaging regression, but ZimaBrain will not call it confirmed without sufficient evidence.
These conditions are also integrated into the existing health timeline and question memory, allowing ZimaBrain to classify them as new, persistent, historical or recovered and compare conclusions across later scans.
We added broad regression coverage for helper and primary-service combinations, missing paths, permissions, 203/EXEC, journal evidence, cautious packaging wording, recovery, persistence and paraphrased questions. The existing broad-domain, comprehensive-health and question-memory suites also passed.
The Docker tag remains the same:
gelbuilding/zimabrain-ce:1.6.0-beta
The image behind that tag has been updated, so pulling or redeploying it will install the new build. GitHub commit: 10ec337.
I found another improvement for the RAUC layer.
I asked:
sudo rauc status
The current report already contains the complete rauc status output, but ZimaBrain only reports:
-
Compatible
-
Host version
-
Kernel
-
Uptime
It does not summarise the actual RAUC slot information.
I think the answer should recognise and present the important fields from the captured rauc status output, for example:
RAUC Status
-
Compatible:
zimaos-zimacube -
Booted slot: kernel.1 (B)
-
Active rootfs: rootfs.1
-
Inactive slot: kernel.0 (A)
-
Boot status: good
-
Activated slot: kernel.1 (B)
Then conclude something like:
RAUC status looks healthy.
Both slots are present and the currently booted slot is marked as good.
If any slot is bad, inactive unexpectedly, or missing, that should then be reported as a possible update problem.
1 Like
@isanto1306, your RAUC improvement has now been added.
You were absolutely right. ZimaBrain was capturing the full rauc status output but was not interpreting the important slot information.
It now reports:
- Compatible system
- Booted kernel slot
- Activated slot
- Active rootfs
- Inactive slot
- Boot status
- Complete parsed slot inventory
It then explains whether the RAUC state looks healthy. If a slot is bad, missing, inconsistent or cannot be fully verified, it reports that cautiously as a possible update problem rather than guessing.
I tested it live on my ZimaCube. It correctly detected kernel.1 (B) as booted and activated, rootfs.1 as active, kernel.0 (A) as inactive, and the boot status as good.
While completing this, I added one extra diagnostic area that I felt was warranted. ZimaBrain can now investigate containers that can read mounted storage but cannot create, rename or delete files. It correlates the Docker bind, host mount state, filesystem type, mount options, numeric ownership, permissions and container UID/GID. It also handles exFAT and NTFS correctly and only offers a safe self-cleaning write test after the exact container and media path are confirmed.
Both improvements are now published. The image tag remains unchanged:
gelbuilding/zimabrain-ce:1.6.0-beta
Thank you again. Your testing directly improved the verifier.