ZimaBrain CE — Local ZimaOS Diagnostic Assistant

This answer is verified, but I think it could be more user-friendly.

When I ask:

“What service is using disk?”

ZimaBrain correctly finds a process from the current report, but it only returns the process name:

zimaos-local-st

As a normal user, I don’t know what that process is or whether it is expected.

I think it would be more helpful if ZimaBrain also explained:

  • Is this a ZimaOS system service?

  • Is this normal background activity?

  • Is it likely to be the cause of constant disk access?

  • Was it only active during the report, or does it appear repeatedly?

Even a short description such as:

“This appears to be a ZimaOS background service. Activity was observed during the report, but one observation alone is not enough to conclude it is the cause of continuous disk activity.”

would make the answer much easier to understand.

1 Like

Thanks, that is very useful feedback. I really appreciate your input.

I agree with these points.

For exited containers, I think you are right. They should not all appear as strong yellow warnings by default. Many users intentionally stop test containers, old containers, migration containers, one-shot jobs, or duplicate containers. I will tune this further so they are treated more like “Needs Review” or “Info” unless there is evidence that the container should be running, belongs to an active stack, or is repeatedly crashing.

The watchdog explanation is exactly the type of improvement I wanted, because a failed watchdog/helper service can look scary, but if the related main service is currently running, the answer needs to say that clearly.

For the Immich path question, I also agree. When the question is:

Check Immich container paths and mounts

the primary answer should focus on Immich first, not every other container using similar storage paths.

A cleaner structure would be better:

Immich verification

Immich Server: mount verified
Upload path: /DATA/.media/sda4/Media/Gallery/immich/upload
Redis: mount verified
Result: No obvious Immich bind-mount issue detected.

Then below that, optional related information:

Other containers using similar storage paths…

That would keep the answer useful for diagnosis without making the user read through Plex, VLC, Firefox, Komga, etc. when they only asked about Immich.

Good catch also on:

Are there any failed services?

You are correct. That question should route directly to the failed-service verifier and inspect the current systemctl evidence. It should not fall back to guidance only, especially because it is one of the suggested test questions.

That means the failed-service backend is there, but this exact natural wording is not being matched correctly. I will add this to the router cleanup so questions like:

Are there any failed services?
Show failed services
Which services failed?
systemctl failed units

go straight to the failed-service diagnostic layer.

I will add this to the next cleanup list:

  • exited containers less prominent unless evidence shows a real fault
  • app-specific path questions should prioritise the named app first
  • related containers should be moved into a separate “related information” section
  • failed-service questions should route directly to the failed-service verifier

Also, for the icon, PNG is perfectly fine. 1024×1024 with a transparent background is ideal.

You can upload it directly here. There is an upload button in the reply toolbar, the up-arrow icon. You can also drag or paste the PNG directly into the reply box and the forum should upload it.

Once I have it, I can add it to the ZimaBrain CE assets and use it for the app tile.

Thanks again, this is exactly the kind of testing that helps clean up the next beta.
One question.

Would you like me to keep testing and reporting things like this, or do you feel I’ve covered the most important areas already?

I don’t want to overwhelm the thread with too many reports if they’re no longer useful. If continued testing helps improve ZimaBrain, I’m happy to keep testing future beta versions and providing feedback.

I tried to upload the SVG, but it looks like the forum doesn’t allow SVG attachments.

I can upload the 1024×1024 transparent PNG instead, or if you prefer, I can share the SVG through GitHub, Google Drive, Dropbox, or another file-sharing service.

ZimaBrain CE cleanup list from isanto1306 feedback

  1. Exited containers severity cleanup
  • Do not show every exited container as a strong yellow warning.
  • Classify intentional/test/old/migration/one-shot containers as Info or Needs Review.
  • Only show yellow when there is evidence the container should be running, belongs to an active stack, or is repeatedly crashing.
  1. App-specific path answers
  • When user asks about a named app, focus on that app first.
  • Example: “Check Immich container paths and mounts” should prioritise Immich containers only.
  • Other containers using similar paths should move into a separate “Related information” section.
  1. Immich mount answer structure
    Expected structure:

Immich verification

  • Immich Server: mount verified
  • Upload path: verified
  • Redis: mount verified
  • Result: No obvious Immich bind-mount issue detected

Related information

  • Other containers using similar storage paths
  1. Failed-service router fix
  • “Are there any failed services?” currently routes to fallback guidance.
  • It should route directly to the failed-service/systemd verifier.
  • Add natural wording matches:
    • Are there any failed services?
    • Show failed services
    • Which services failed?
    • systemctl failed units
    • failed systemd units
  1. Disk activity explanation improvement
  • “What service is using disk?” is verified, but too technical.
  • If it finds a process like zimaos-local-st, explain what it likely is.
  • Add service/process explanation:
    • Is it a ZimaOS system service?
    • Is it normal background activity?
    • Is one observation enough to prove constant disk activity?
    • Was it active only during this report, or seen repeatedly?
  1. Disk activity wording
    Expected wording:

“This appears to be a ZimaOS background service. Activity was observed during the report, but one observation alone is not enough to conclude it is the cause of continuous disk activity.”

  1. Repeated activity / trend logic
  • Current report can show one-time disk activity.
  • Future improvement should compare repeated exports or trend history before saying something is constantly using disk.
  • Mark as “observed during report” unless repeated evidence exists.
  1. User-friendly process names
  • Convert short process names into plain English where possible.
  • Example:
    • zimaos-local-st = likely ZimaOS local storage service
    • dockerd = Docker daemon
    • containerd = container runtime
    • netdata = monitoring agent
    • qBittorrent / Immich / Plex = user app container process
  1. Failed-service dashboard consistency
  • Suggested questions must match real router behaviour.
  • If “Are there any failed services?” is listed as a test question, it must use the same systemctl evidence shown in the dashboard panels.
  • Avoid suggested questions that only return fallback guidance.
  1. Icon asset
  • Accept PNG 1024×1024 transparent background.
  • Add to ZimaBrain CE assets.
  • Use for app tile.

https://drive.google.com/drive/folders/1vZRg6vDkEi9Jju5RwKLeymXJeGBiSHfI?usp=sharing

1 Like

Yes please, keep testing and reporting things like this.

I am very happy to receive your feedback. It is very good, and I really appreciate it.

You are not overwhelming the thread. This type of testing is exactly what helps improve ZimaBrain CE, because you are asking normal user questions and showing where the answer is still too technical, too broad, or routed to the wrong verifier.

The most useful feedback is exactly what you have been doing:

  • the question you asked
  • what ZimaBrain answered
  • what you expected instead
  • whether the answer was too broad, too technical, or confusing

That helps me clean up the next beta much faster.

For the icon, if the forum does not allow SVG, the 1024×1024 transparent PNG is perfectly fine. Please upload the PNG here using the upload button or by dragging it into the reply box.

If you still want to share the SVG as well, GitHub, Google Drive, Dropbox, or any file-sharing link is fine too.

Thanks again, I really appreciate your time and input.

CRC errors usually indicate communication problems between the drive and the controller (for example, a SATA cable or connector), not necessarily a failing disk.

If the counter remains stable over time, it is usually a historical issue.
If it continues increasing, the connection should be investigated.

This is one of the strongest answers so far. I especially like that ZimaBrain no longer relies only on “SMART PASSED”.

One suggestion would be to explain the meaning of CRC errors and NVMe unsafe shutdowns in a little more detail.

For example:

  • CRC errors often indicate a communication problem (cable, connector or controller), not necessarily a failing drive.

  • NVMe unsafe shutdowns are historical counters. A high value does not automatically indicate a failing SSD. The trend is often more important than the absolute number.

I think adding this short context would help normal users understand the findings without causing unnecessary concern.

1 Like

This answer is correct, but I think it could be clearer for normal users.

ZimaBrain correctly reports that systemd-networkd-wait-online.service is not failed, which is good.

However, the explanation:

“The service is present in the hotlist…”

is quite technical. Most users won’t know what the “hotlist” means.

I think it would be more helpful to explain why the service is inactive (dead) but still considered healthy.

For example:

systemd-networkd-wait-online is a one-shot system service. It waits for the network during boot and then exits normally. An inactive (dead) state with Result=success is expected and does not indicate a problem.

That would make it much clearer that this is normal behaviour and not something the user needs to worry about.

I also think the “Why it matters” section should focus more on what the state means for the user rather than internal implementation details like the hotlist.

1 Like

Why is Immich not starting?

Another observation from testing.

The routing is much better now because ZimaBrain correctly detects the app (Immich) and uses the App Runtime Diagnostics layer.

However, the answer is still very generic.

When I ask:

“Why is Immich not starting?”

I would expect ZimaBrain to first check the evidence it already has and tell me what it found.

For example:

Is the immich-server container running or exited?
Is immich-redis running?
Are there any restart loops?
Are the bind mounts present?
Does the upload path exist?

If none of those checks show a problem, it could simply say:

“No obvious runtime issue was found from the current report. Additional log inspection is required to determine the root cause.”

At the moment, the answer mainly lists what should be checked, rather than explaining what has already been verified from the available evidence.

I think ZimaBrain should always separate:

Verified from current report

What was actually checked.
What passed.
What failed.

Not yet verified

What still requires logs or additional inspection.

That would make the answer much more actionable and easier to understand.

1 Like

Another small suggestion.

This answer is technically correct, but I think it could be clearer for normal users.

zimaos-welcome.service is reported as:

  • ActiveState = inactive

  • SubState = dead

  • Result = success

That is normal behaviour for a one-shot service, but the current explanation doesn’t really tell the user that.

Instead of:

“Service-specific status is now captured so questions about zimaos-welcome do not fall back to generic guidance.”

I think it would be more helpful to explain what the status actually means.

For example:

zimaos-welcome is a one-shot service. It runs during boot or the initial setup, completes its task, and then exits normally. An inactive (dead) state together with Result=success is expected and does not indicate a problem.

I think the “Why it matters” section should focus on helping the user understand the service status, rather than explaining how the verifier internally routed the question.

The implementation details (routing, verifier, hotlist, etc.) are interesting for developers, but most users mainly want to know:

  • Is this normal?

  • Is something broken?

  • Do I need to do anything?


ZimaBrain CE beta update

The new icon from @isanto1306 has now been added and tested.

It now shows correctly in:

- the ZimaOS app tile
- the ZimaBrain CE dashboard header

Thank you again @isanto1306, I really appreciate your help with the icon and the testing feedback.

The Docker image has also been rebuilt and pushed again:

gelbuilding/zimabrain-ce:1.6.0-beta

Latest image digest:

sha256:fab532df97318d7e2a91b5f5806dff4cd9e3bd2fa965ac59427cd0bcc226573f

Use this Custom App install script:

Then paste this under it:

name: zimabrain-ce

services:
  zimabrain-ce:
    image: gelbuilding/zimabrain-ce:1.6.0-beta
    container_name: zimabrain-ce
    restart: unless-stopped

    ports:
      - "8601:8601"

    environment:
      ZIMABRAIN_PASSWORD: "change-this-password"
      ZIMABRAIN_SECRET_KEY: "change-this-secret-key"

    volumes:
      - /DATA/AppData/zimabrain-ce:/data
      - /DATA/AppData/zimabrain-ce/docs:/app/docs
      - /proc:/host/proc:ro
      - /sys:/host/sys:ro
      - /etc/hostname:/host/etc/hostname:ro
      - /var/run/docker.sock:/var/run/docker.sock

x-casaos:
  architectures:
    - amd64
  main: zimabrain-ce
  author: gelbuilding
  category: Utilities
  description:
    en_us: Local ZimaOS diagnostic assistant with verifier-first evidence checks.
  developer: gelbuilding
  hostname: ""
  icon: "https://raw.githubusercontent.com/Jacko88888/zimabrain-ce/main/app/assets/zimabrain-ce-logo.png?v=2"
  index: /
  port_map: "8601"
  scheme: http
  store_app_id: zimabrain-ce
  tagline:
    en_us: Local ZimaOS diagnostic assistant
  title:
    en_us: ZimaBrain CE

Then add:

Important:

Please change these before installing:

ZIMABRAIN_PASSWORD: "change-this-password"
ZIMABRAIN_SECRET_KEY: "change-this-secret-key"

ZIMABRAIN_PASSWORD is the login password.

ZIMABRAIN_SECRET_KEY is not a login password. It is only used internally by the app for browser/session security.

If you installed an older test version before and the password does not work, reset the saved password hash:

sudo rm -f /DATA/AppData/zimabrain-ce/.zimabrain_password_hash
sudo docker restart zimabrain-ce

Then log in using the value you set for ZIMABRAIN_PASSWORD.
1 Like

Thank you again for all the testing and detailed feedback.

I really appreciate the effort you are putting into this. Your reports are very useful because they are exactly the type of questions normal users will ask, and they show clearly where ZimaBrain CE needs to be cleaner, less alarming, or more specific.

I have added your feedback to the next cleanup list, including:

  • exited containers should be less prominent unless there is evidence of a real fault
  • app-specific questions should focus on the named app first
  • failed-service questions should route directly to the systemd verifier
  • disk activity answers should explain the process in plain English
  • one-time activity should not be treated as constant activity
  • related information should be separated from the main answer

This is very helpful beta feedback, not noise.

Thanks also for the icon. It has now been added and tested in the ZimaOS tile and the ZimaBrain CE dashboard header.

Really appreciate your time and input.

1 Like

One small thing I noticed.

The new icon looks great inside ZimaOS and in the dashboard, but in the browser tab (favicon) it still shows the default globe icon instead of the ZimaBrain icon.

It’s not a problem, just something I noticed while testing. When you have time, it might be nice to use the ZimaBrain icon there as well, so the branding is consistent.

I found another routing case while testing.

I asked:

“Are there any failed ZimaOS services?”

This still falls back to the guidance route instead of using the failed-service verifier.

Since the question clearly contains both “failed” and “services”, I would expect it to be treated the same as:

  • Are there any failed services?

  • Show failed services

  • Which services failed?

  • failed systemd units

It might be worth extending the natural-language matching so that adding “ZimaOS” doesn’t prevent the question from reaching the correct diagnostic layer.

I think most users will naturally ask questions like “Are there any failed ZimaOS services?” rather than “systemctl failed units”, so it would improve usability if these variations were recognised as the same intent.

1 Like

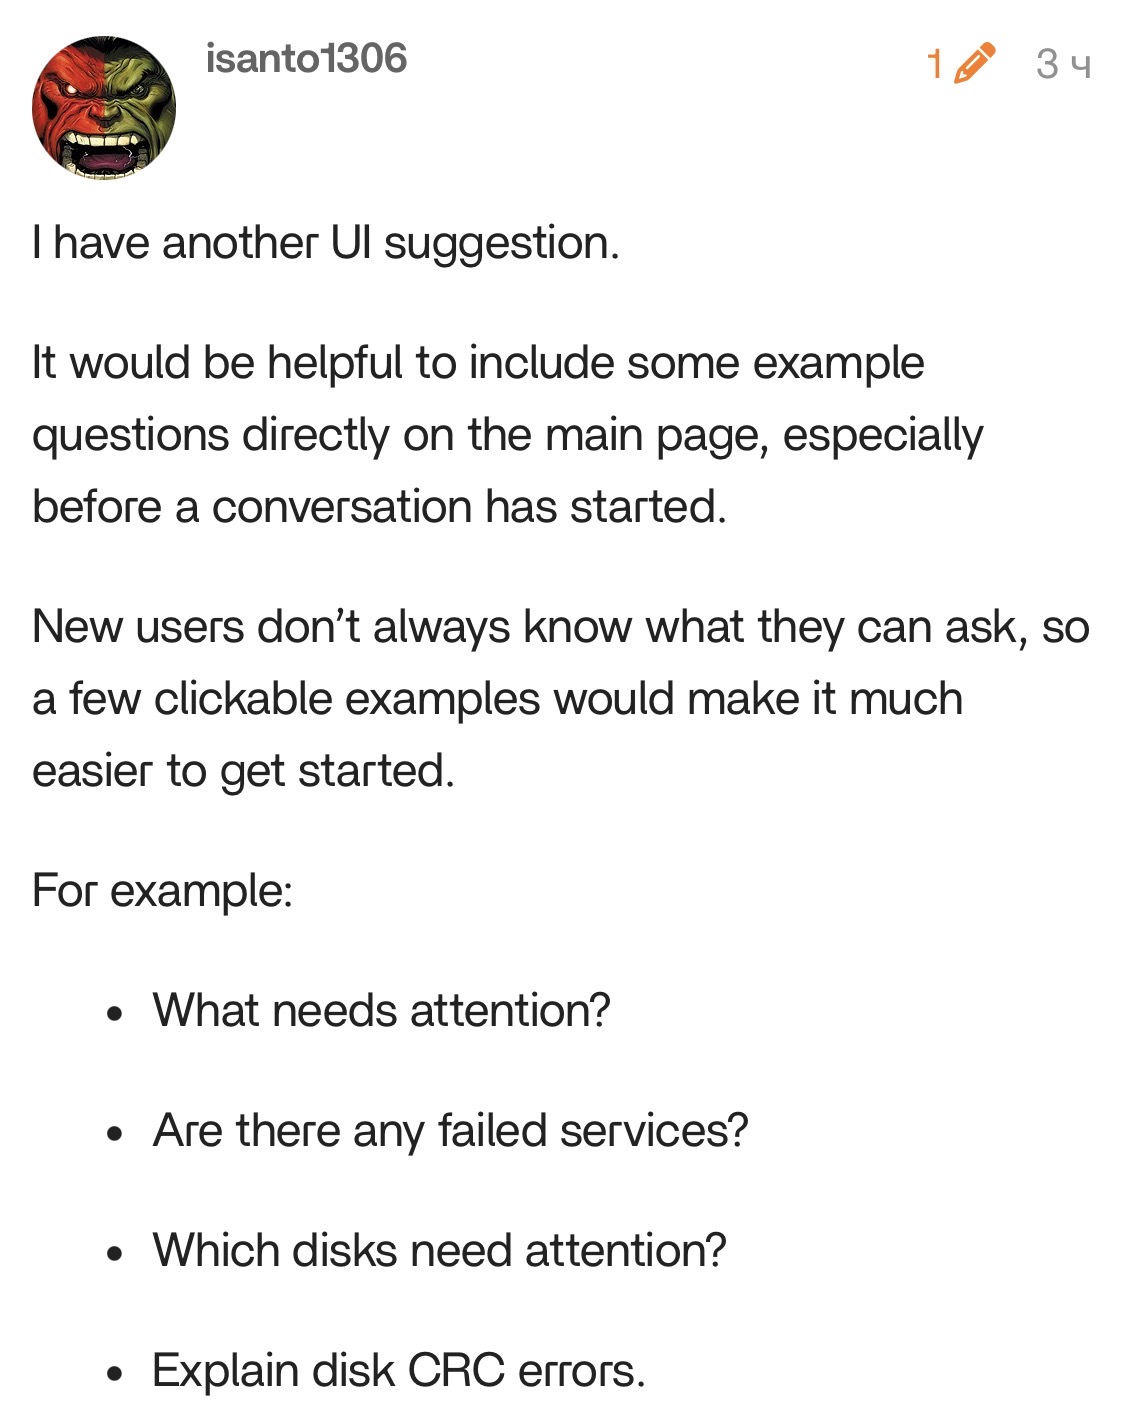
I have another UI suggestion.

It would be helpful to include some example questions directly on the main page, especially before a conversation has started.

New users don’t always know what they can ask, so a few clickable examples would make it much easier to get started.

For example:

  • What needs attention?

  • Are there any failed services?

  • Which disks need attention?

  • Explain disk CRC errors.

  • What service is using disk?

  • What is using CPU?

  • Which containers are not running?

  • Check Immich container paths and mounts.

  • Are there any Files / AppData / media path problems?

I also have another idea that could be useful for regular users.

It would be great if users could save their own custom questions or prompts as favourites.

For example, I might have a question that I use every day. Instead of typing it again, I could simply click on my saved prompt.

A simple “Save as Favourite” button or a small “My Questions” section would make ZimaBrain much more convenient for daily use.

This would allow every user to build their own personal library of frequently used diagnostic questions while still keeping the default example questions for new users.

I think this would make ZimaBrain feel more like a real diagnostic assistant than just a chat interface.

1 Like

ZimaBrain CE next cleanup/update plan from isanto1306 feedback

  1. Failed-service routing fixes
  • “Are there any failed services?”
  • “Are there any failed ZimaOS services?”
  • “Show failed services”
  • “Which services failed?”
  • “failed systemd units”
  • “systemctl failed units”
    should all route to the failed-service/systemd verifier.
  1. Main page example questions
    Add clickable starter questions on the main page, such as:
  • What needs attention?
  • Are there any failed services?
  • Which disks need attention?
  • Explain disk CRC errors.
  • What service is using disk?
  • What is using CPU?
  • Which containers are not running?
  • Check Immich container paths and mounts.
  • Are there any Files / AppData / media path problems?
  1. Favourite / saved questions
  • Add “Save as Favourite”
  • Add “My Questions”
  • Let users save their own regular diagnostic prompts.
  1. Exited containers severity cleanup
  • Do not show all exited containers as strong yellow warnings.
  • Treat test/old/migration/one-shot/on-demand containers as Info or Needs Review.
  • Only warn strongly when evidence shows the container should be running or is repeatedly crashing.
  1. Real Alerts / Info Only mapping polish
  • Real Alerts should show source/object/condition where possible.
  • Info Only items should explain what they are, not only show a count.
  • Unsupported/N/A SMART or sensor items should stay Info.
  1. App-specific path answers
  • Named app questions should focus on the named app first.
  • Example: Immich path question should focus on Immich containers first.
  • Other containers should move to “Related information.”
  1. Immich mount answer structure
  • Immich Server: mount verified
  • Upload path: verified
  • Redis: mount verified
  • Result: No obvious Immich bind-mount issue detected
  • Related information below only if needed.
  1. Watchdog/helper service classification
  • Failed watchdog/helper units should not automatically look like outages.
  • If the related main service is running, explain that clearly.
  • Example: failed watchdog but main service active = historical/helper issue, not current outage.
  1. Related service correlation
  • tailscaled-watchdog.service → tailscaled.service
  • zfw-ui-watchdog.service → zfw-ui.service
  • plex-delay.service → Plex container/service
  • startup.service → referenced script path
  1. Missing helper / missing script root-cause detection
  • Failed units should show missing ExecStart/helper/script paths.
  • Example: missing /DATA/startup.sh
  • Example: missing /usr/libexec/targetcli-sync-users
  1. ZimaOS packaging regression classification
  • If an OS-provided helper is missing after an update, classify as possible ZimaOS packaging regression.
  • Separate this from local user configuration mistakes.
  1. Files / AppData / media routing
  • Files / AppData / media questions should route to the Files/AppData/media verifier.
  • Include /media, /DATA/.media, /var/lib/casaos_data/.media, AppData path, media path problem.
  1. Files / AppData / media evidence cleanup
  • Do not use “nsenter: reassociate to namespaces failed” as proof of a media path issue.
  • Treat it as evidence collection limitation.
  1. Files app move regression watch
    Confirmed pattern:
  • ZimaOS 1.6.2
  • ZimaOS Files app move operation
  • source sda1
  • destination sda4
  • both ext4
  • both internal SATA
  • files move successfully
  • source folder remains empty
  • copy not affected
  • small test folder also affected
  1. ZimaOS regression-intake routing
    Recognise wording like:
  • started after updating to 1.6.2
  • worked before update
  • new regression
  • Files app issue after update
  1. Disk activity plain-English explanation
  • Explain process names like zimaos-local-st.
  • Say whether it is likely a ZimaOS background service.
  • Say one observation does not prove constant disk activity.
  1. Repeated activity / trend wording
  • Use “observed during this report”
  • Do not imply constant disk use unless repeated evidence confirms it.
  1. User-friendly process names
  • zimaos-local-st = likely ZimaOS local storage service
  • dockerd = Docker daemon
  • containerd = container runtime
  • netdata = monitoring agent
  • systemd-journald = system log service
  1. Cleaner forum-ready output
    Use:
  • Confirmed
  • Not confirmed
  • Next safest step
  1. Password guidance
  • ZIMABRAIN_PASSWORD = login password
  • ZIMABRAIN_SECRET_KEY = internal session/security key
  • Explain saved hash reset path.

One more future idea I want to add separately is a ZimaBrain memory layer.

Not cloud memory, but local ZimaOS memory.

The idea would be that ZimaBrain can remember repeated local patterns on the same machine, for example:

  • this container is normally stopped
  • this service often fails at boot but the main service is running
  • this disk usually shows the same warning
  • this user often asks the same daily diagnostic questions
  • this issue started after a specific ZimaOS update
  • this machine has a known App Store Tailscale setup
  • this AppData path or media path is normal for this system

That would help ZimaBrain avoid repeating the same warnings every time and make the answers more personal to the actual machine.

For example, instead of saying every time:

“container X is exited”

it could eventually say:

“container X is normally stopped on this system and has been seen in this state before, so this is Info unless the user expects it to be running.”

This would also connect well with the saved questions / favourites idea.

For now I want to clean up the router, verifier answers and UI first, but I think a local memory layer would be a very important next step for making ZimaBrain feel like a real daily diagnostic assistant.

1 Like

21. Health Timeline / Trend Analysis

Instead of only showing the current system state, ZimaBrain could also keep a local history of important health metrics and compare them over time.

This would help users distinguish between historical warnings and new or worsening problems.

Examples

Disk CRC Errors

/dev/sdc

15 Jul   CRC_Error_Count = 289
16 Jul   CRC_Error_Count = 289
17 Jul   CRC_Error_Count = 289
18 Jul   CRC_Error_Count = 290

Status:
⚠ CRC error count increased since the previous report.

NVMe Unsafe Shutdowns

/dev/nvme0n1

Previous report: 112
Current report: 112

Status:
ℹ No change detected.
Historical value only.

SMART Health

Previous report:
Current_Pending_Sector = 0

Current report:
Current_Pending_Sector = 2

Status:
🔴 New SMART warning detected.

Container History

Immich Server

Last 10 reports

✔ Running
✔ Running
✔ Running
✖ Exited
✔ Running
✔ Running

Status:
Temporary interruption detected.

Service History

tailscaled-watchdog.service

Last 20 boots

✖ Failed
✖ Failed
✖ Failed
✖ Failed

tailscaled.service

✔ Running
✔ Running
✔ Running
✔ Running

Status:
Known historical watchdog issue.
Main service remains healthy.

Disk Activity Trends

Instead of saying:

This process is using disk.

ZimaBrain could report:

zimaos-local-st

Current report:
Observed active disk I/O

Previous 10 reports:
Not observed

Status:
Likely temporary background activity.

or

Observed in 12 consecutive reports.

Status:
Persistent disk activity.

Benefits

  • Distinguishes historical issues from new problems.

  • Prevents repeated warnings for unchanged conditions.

  • Detects trends instead of relying on a single report.

  • Makes diagnostics much more useful for long-term system monitoring.

  • Helps users identify regressions after ZimaOS updates.

  • Reduces unnecessary concern by showing whether a warning is stable or worsening.

This feature would make ZimaBrain feel much more like a real long-term diagnostic assistant rather than only analysing one report at a time.

1 Like
  1. Health Timeline / Local Memory Layer

Planned idea:
ZimaBrain should keep a local history of important system health signals and compare them over time, instead of only analysing one report at a time.

This would help separate:

  • new issues
  • unchanged historical warnings
  • worsening trends
  • temporary one-off activity
  • repeated/persistent faults

Examples to track:

  • Disk CRC error count
  • NVMe unsafe shutdown count
  • SMART pending sectors
  • container running/exited history
  • failed service history across boots
  • disk I/O process history
  • ZimaOS update/regression timing
  • AppData/media path changes

Expected behaviour:

  • If CRC count stays the same, mark as historical/stable.
  • If CRC count increases, mark as worsening.
  • If NVMe unsafe shutdown count is unchanged, mark as historical value only.
  • If a container exited once but normally runs, mark as temporary interruption.
  • If a watchdog failed repeatedly but the main service is always running, mark as known historical helper issue.
  • If disk I/O process appears once, mark as observed during this report only.
  • If disk I/O appears across many reports, mark as persistent activity.

Benefit:
This would make ZimaBrain feel like a long-term local diagnostic assistant, not just a one-report analyser.

1 Like

I previously suggested to Georgiy that he create a drop-down list of pre-made questions; if a question like that wasn’t in the list, he could enter his own (perhaps with a hint). Adding sample questions to the main screen or creating an interactive menu, in my opinion, would make the interface less user-friendly and more cumbersome.

Sorry for the huge screenshot, I was writing this on my phone at work and now I can’t edit it.

For me, as a regular user, the phrase "- :yellow_circle: YELLOW: Path to ZimaOS media mirror missing

  • :yellow_circle: YELLOW: Systemd unit failure detected" doesn’t tell me anything. Where is the path? To figure out where to look.