I just put in the two top lines with this outcome …
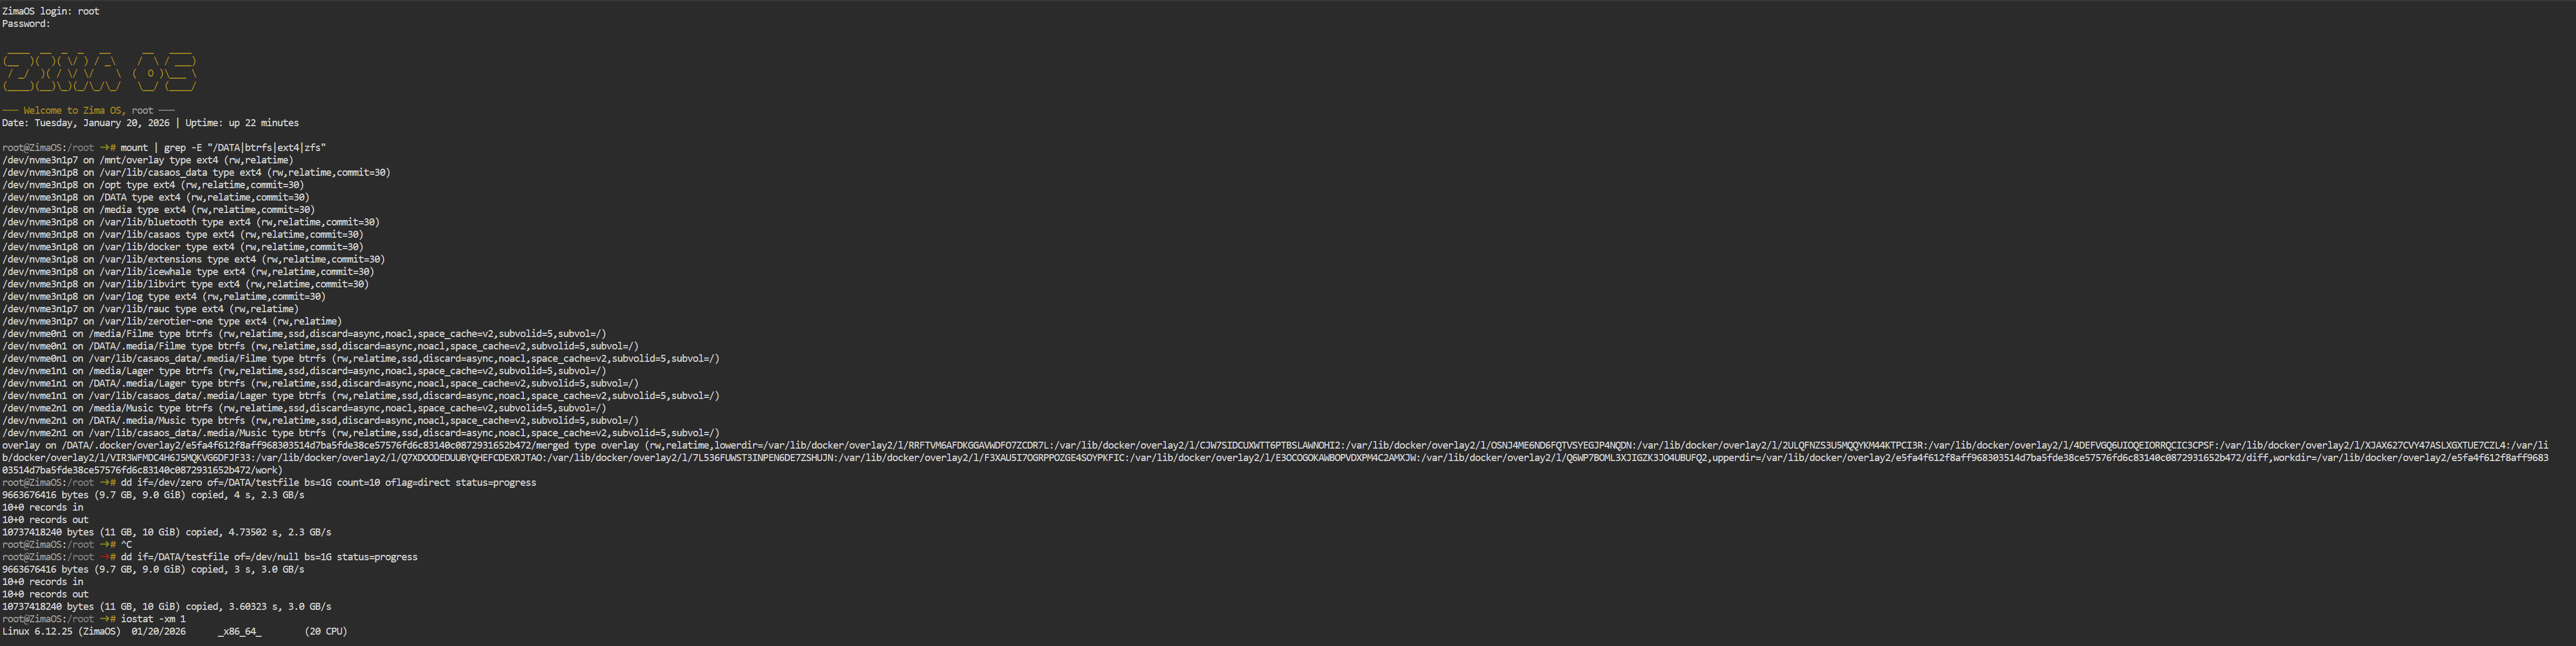
─── Welcome to Zima OS, root ───
Date: Tuesday, January 20, 2026 | Uptime: up 56 minutes
root@ZimaOS:/root ➜ # dd if=/dev/zero of=/DATA/testfile bs=1G count=10 oflag=direct status=progress
9663676416 bytes (9.7 GB, 9.0 GiB) copied, 4 s, 2.3 GB/s
10+0 records in
10+0 records out
10737418240 bytes (11 GB, 10 GiB) copied, 4.73161 s, 2.3 GB/s
root@ZimaOS:/root ➜ # dd if=/DATA/testfile of=/dev/null bs=1G status=progress
9663676416 bytes (9.7 GB, 9.0 GiB) copied, 3 s, 3.0 GB/s
10+0 records in
10+0 records out
10737418240 bytes (11 GB, 10 GiB) copied, 3.5691 s, 3.0 GB/s
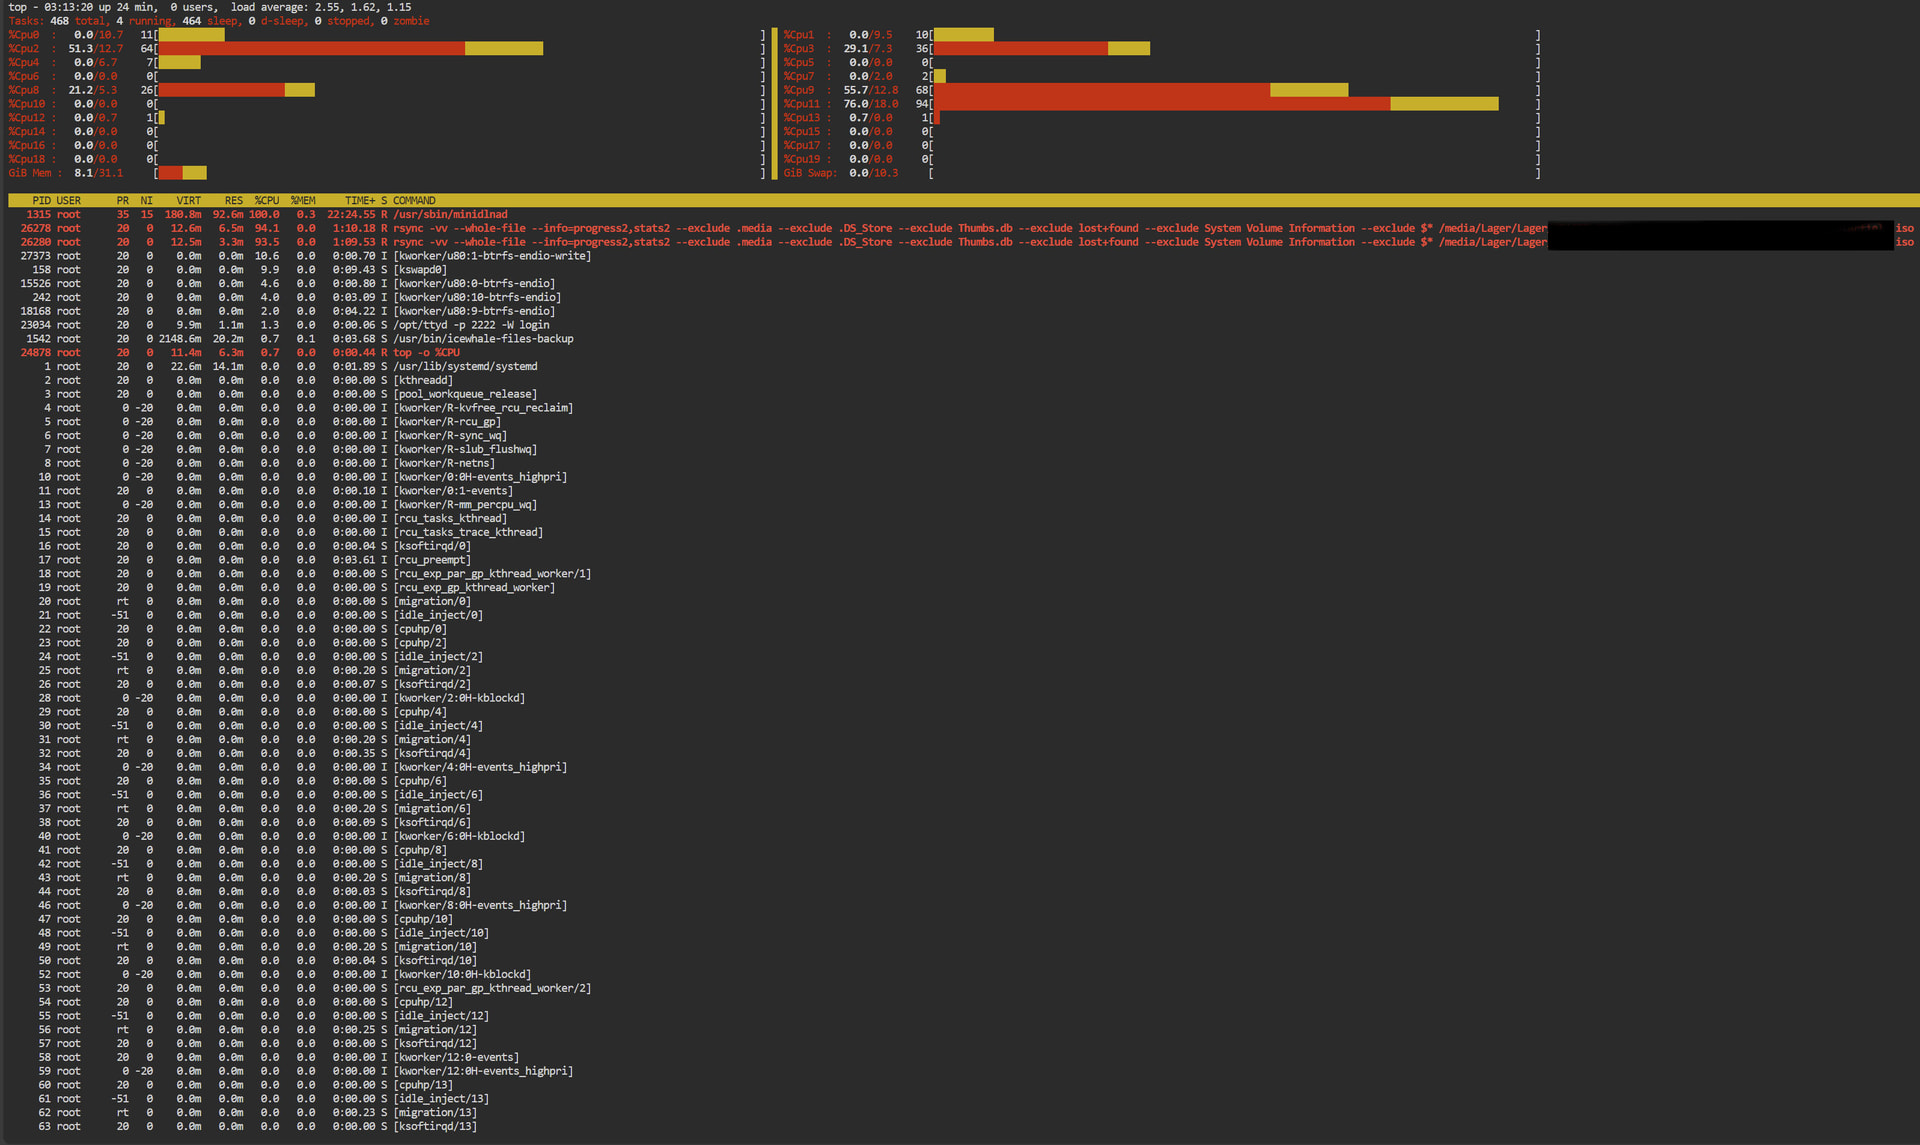
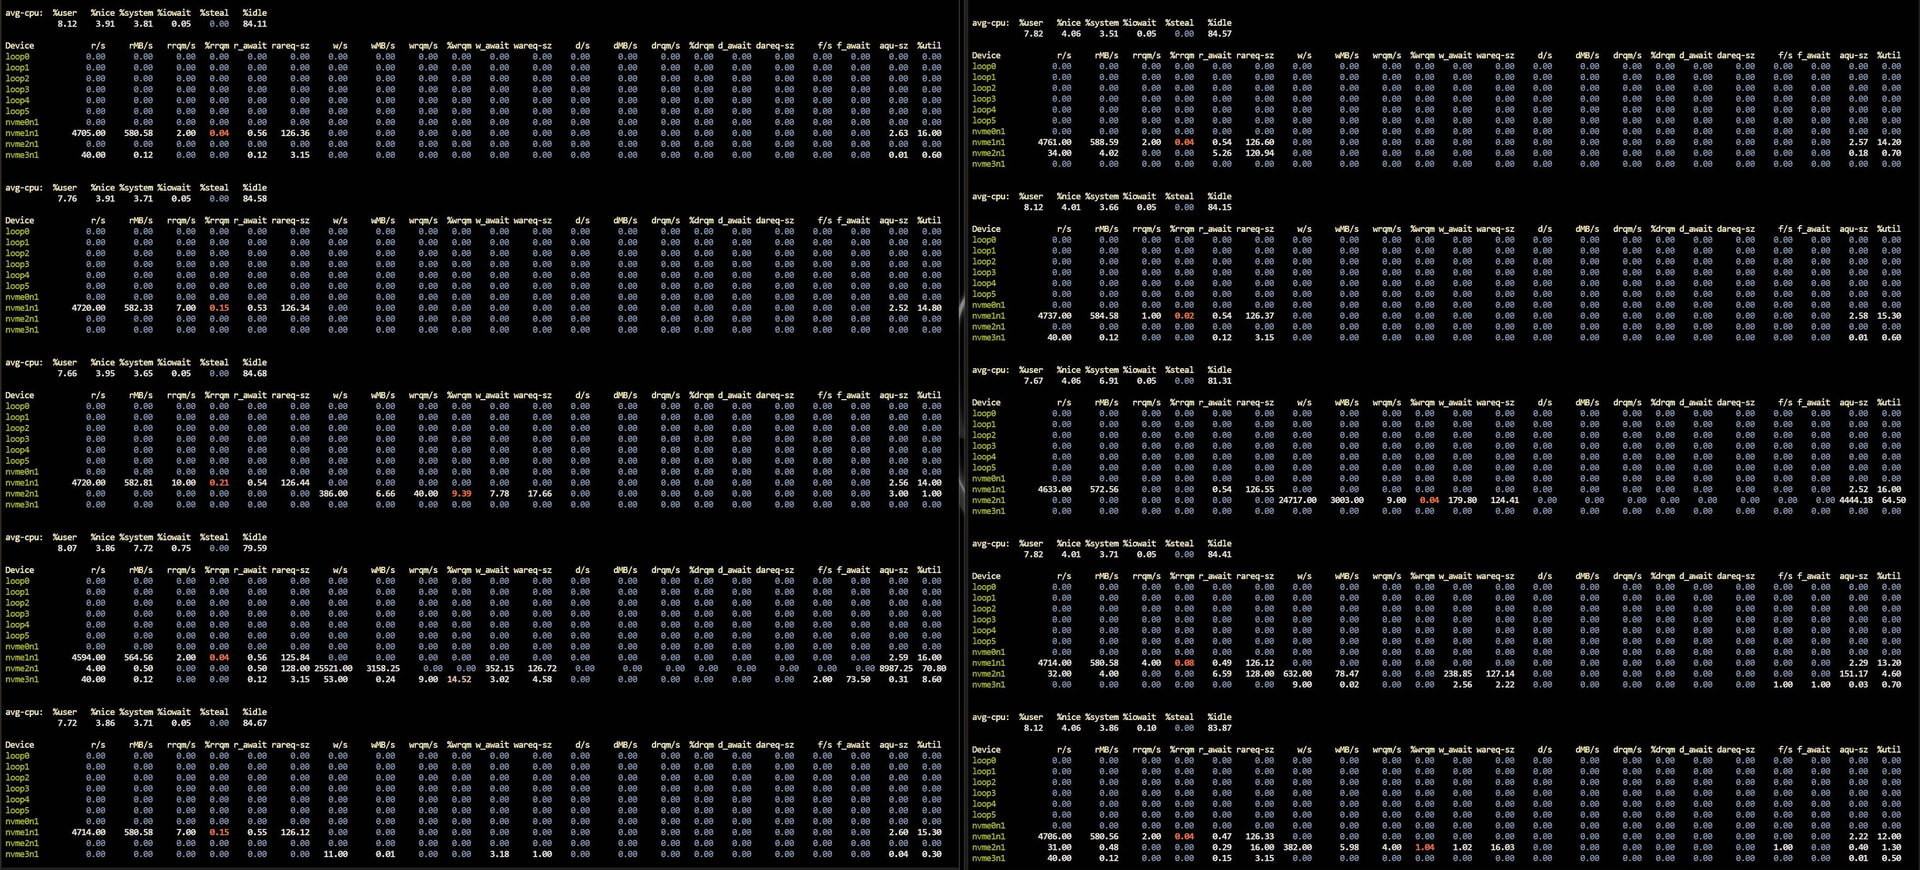
but I can’t use the iostat and top, cause this is happening way too fast and I doN’t know how to use two terminal side by side
this is the output of the fio command line
root@ZimaOS:/root ➜ # fio --name=nvme --filename=/DATA/fio.test --size=10G --rw=write --bs=1M --iodepth=32 --numjobs=1 --direct=1 --runtime=30 --group_reporting
nvme: (g=0): rw=write, bs=(R) 1024KiB-1024KiB, (W) 1024KiB-1024KiB, (T) 1024KiB-1024KiB, ioengine=psync, iodepth=32
fio-3.38
Starting 1 process
nvme: Laying out IO file (1 file / 10240MiB)
note: both iodepth >= 1 and synchronous I/O engine are selected, queue depth will be capped at 1
Jobs: 1 (f=1): [W(1)][100.0%][w=2179MiB/s][w=2179 IOPS][eta 00m:00s]
nvme: (groupid=0, jobs=1): err= 0: pid=61517: Tue Jan 20 02:11:41 2026
write: IOPS=2162, BW=2163MiB/s (2268MB/s)(10.0GiB/4735msec); 0 zone resets
clat (usec): min=401, max=7285, avg=434.48, stdev=312.80
lat (usec): min=421, max=7319, avg=462.08, stdev=312.99
clat percentiles (usec):
| 1.00th=[ 408], 5.00th=[ 408], 10.00th=[ 408], 20.00th=[ 412],
| 30.00th=[ 412], 40.00th=[ 412], 50.00th=[ 412], 60.00th=[ 412],
| 70.00th=[ 416], 80.00th=[ 420], 90.00th=[ 424], 95.00th=[ 437],
| 99.00th=[ 594], 99.50th=[ 701], 99.90th=[ 6259], 99.95th=[ 6259],
| 99.99th=[ 6325]
bw ( MiB/s): min= 2108, max= 2182, per=99.99%, avg=2162.44, stdev=24.84, samples=9
iops : min= 2108, max= 2182, avg=2162.44, stdev=24.84, samples=9
lat (usec) : 500=98.22%, 750=1.38%, 1000=0.10%
lat (msec) : 2=0.01%, 4=0.01%, 10=0.28%
cpu : usr=6.38%, sys=8.87%, ctx=10241, majf=0, minf=8
IO depths : 1=100.0%, 2=0.0%, 4=0.0%, 8=0.0%, 16=0.0%, 32=0.0%, >=64=0.0%
submit : 0=0.0%, 4=100.0%, 8=0.0%, 16=0.0%, 32=0.0%, 64=0.0%, >=64=0.0%
complete : 0=0.0%, 4=100.0%, 8=0.0%, 16=0.0%, 32=0.0%, 64=0.0%, >=64=0.0%
issued rwts: total=0,10240,0,0 short=0,0,0,0 dropped=0,0,0,0
latency : target=0, window=0, percentile=100.00%, depth=32
Run status group 0 (all jobs):
WRITE: bw=2163MiB/s (2268MB/s), 2163MiB/s-2163MiB/s (2268MB/s-2268MB/s), io=10.0GiB (10.7GB), run=4735-4735msec
Disk stats (read/write):
nvme3n1: ios=82/79977, sectors=516/20470100, merge=0/0, ticks=62/19604, in_queue=19667, util=85.04%