Yes, using a clean port convention is fine, but I would separate host ports from container internal ports.
For Prometheus scraping, the important part is the port the exporter is actually listening on.
Typical defaults are:
Prometheus:    9090
node_exporter: 9100
cAdvisor:      8080
Grafana:       3000
You can map them to cleaner external ports if you want, for example:
Grafana host port: 9200 -> container port 3000
cAdvisor host port: 9101 -> container port 8080
But inside Prometheus, the target must match the real reachable address.
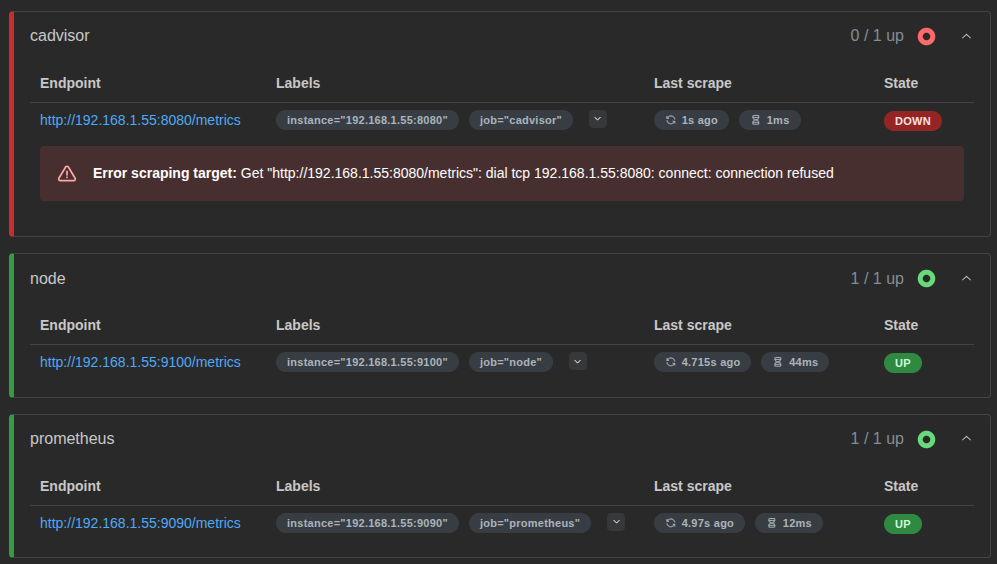
Your screenshot shows:
http://192.168.1.55:8080/metrics
connection refused
That usually means Prometheus can reach the IP, but nothing is listening on port 8080 there, or cAdvisor is not mapped to that host port.
I would check cAdvisor first:
docker ps -a | grep -i cadvisor
Then check the actual port mapping:
docker port cadvisor
And check the logs:
docker logs cadvisor --tail=100
If cAdvisor is mapped like this:
0.0.0.0:9101->8080/tcp
Then your Prometheus target should be:
  - job_name: 'cadvisor'
    static_configs:
      - targets: ['192.168.1.55:9101']
If Prometheus and cAdvisor are on the same Docker network, then you can normally use:
  - job_name: 'cadvisor'
    static_configs:
      - targets: ['cadvisor:8080']
So yes, the monitoring plan is good. I would just avoid changing the container internal ports unless needed. Keep the exporter defaults internally, then only customise the host-side ports if you want a cleaner convention.